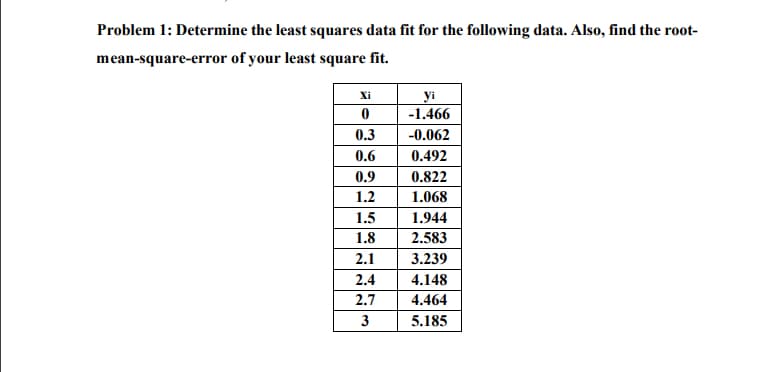
Problem 1: Determine the least squares data fit for the following data. Also, find the root- mean-square-error of your least square fit. Xi yi -1.466 0.3 -0.062 0.6 0.492 0.9 0.822 1.2 1.068 1.5 1.944 1.8 2.583 2.1 3.239 2.4 4.148 2.7 4.464 3 5.185


Q: 6. The price for sugar cane is D(q) = 900 – 20q – q? (in dollars per ton) when the demand for the…
A: Given that, The price for sugar cane, when the demand for the product is q tons is…
Q: Previous research has shown that the mean number of ballpoint pens Americans use per year is 4.3…
A: Given that Sample size n =20 Population mean =4.3 Population standard deviation =1.17 Sample mean…
Q: It takes an average of 12.8 minutes for blood to begin clotting after an injury. An EMT wants to see…
A: As per our guidelines we can solve first three sub part of question and rest can be reposted.…
Q: 38,42,77,47,74,51,48,41,82,72,74,129 Median:_______ Q1:_______ Q3:_______
A: Given that data 38,42,77,47,74,51,48,41,82,72,74,129 Median = middle value of the data set.…
Q: a) Verify that the conditions for the use of the normal model are met using the 2015 study. b) Why…
A: Given Information: Sample size n=100 Sample proportion p^=0.62 Hypothesized value of population…
Q: (Following Hogg, McKean & OCraig, exercise 11.2.2) Let X1, X2, ..., X10 be a random sample from a…
A:
Q: Use the following data to perform a regression analysis. What is the null hypothesis? What is the…
A: Given that X Y X \cdot YX⋅Y X^2X2 Y^2Y2 1 132 132 1 17424 2 131 262 4 17161 3 134…
Q: Attest is used to test the null hypotheses Ho'u = 100. A random sample of 25 values gave a sample…
A: It is given that Sample size n = 25 Sample mean = 110 Sample SD s = 20 Population mean = 100
Q: Two researchers studied the relationship of positive emotions and longevity by examining smile…
A: from the given information Archival research can be defined as the research which involves primary…
Q: the appropriate appendix tabie technology to answer this questi IQ scores (as measured by the…
A: Mean(µ) = 95Standard deviations (σ) = 11X ~ N (µ, σ )= N(95, 11)
Q: 211 384 396 211 224 337 395 121 356 621 367 408 515 280 289 180 431 176 318 836 203 374 224 121 412…
A: Given The number of faculty at 32 randomly selected state-controlled colleges and Universities with…
Q: A. The table below shows the probability distribution of a discrete random variable B. в 1 3 4 5…
A: A
Q: s the distribution a discrete probability distribution? Why? Choose the correct answer below. O A.…
A: We have given the statement Distribution is a discrete probability distribution.
Q: (g) The number of students who received grades of 75 or higher. (h) The number of students who…
A: We have given the data of 80 students. Note: According to Bartleby expert guidelines, we can…
Q: 17.18 4S overall mortality. The 4S study introduced in Exercise 17.17 also tallied deaths due to…
A:
Q: At a drug rehab center 32% experience depression and 27% experience weight gain. 13% experience…
A: Given 32% experience depression 27% experience weight loss 13% experience both We have to find…
Q: lomly selected a group rmation. Table 1 provie stions. ondent # How much a risk would do you thin…
A:
Q: 80% of all Americans live in cities with population greater than 100,000 people. If 38 Americans are…
A:
Q: Which of the following would likely show a bimodal distribution in a histogram? The number of hours…
A:
Q: In a chess tournament, each pair of participants must play with each other exactly once. Two players…
A: Let the total number of players at the beginning be n When 2 players quit, the number of players…
Q: A. Directions: Given the table below; calculate the mean, variance and standard deviation. D 1 2…
A:
Q: Question 7 7.1 Consider the following quarterly demand levels for electricity (1000 megawatts) in…
A:
Q: QUESTION 4 If statistical evidence is found against the null hypothesis, then we the null…
A: Hypothesis Testing Hypothesis testing is an inferential method that uses sample data to make…
Q: of the table is also included below. What is the null hypothesis for determining the correlation…
A: Correlation: Extraversion openness agreeableness conscientiousness neuroticism self-efficacy…
Q: Another organization wants to perform a similar analysis on Department A’s and Department B’s…
A: A hypothesis which is tested for plausible rejection is called the Null Hypothesis (typically…
Q: A certain test is designed to measure the satisfaction of an individual with his/her relationship.…
A:
Q: In a test of the effectiveness of garlic for lowering cholesterol, 64 subjects were treated with raw…
A:
Q: D. Using a 0.01 level of significance, test the hypothesis that there is no significant linear…
A: Given Information: The dependent variable (y) is Converted sugar. The independent variable (x) is…
Q: 2. What is the weight of the coalition {A, D, E}? Is {A, D, E} a winning coalition? A weighted…
A: Given information: weight of voter A=30 weight of voter B=12 weight of voter C=9 weight of voter D=5…
Q: A result is significant at the 0.01 level. Explain why it must also be significant at the 0.05…
A: 1. It is needed to elaborate the relation of P-value with level of significance.
Q: (b) Estimate the sample size needed if no estimate of p is available. A sample of 504 adults is…
A: Given that m.e=0.03,alpha=0.002 ( 2 ) n=?
Q: 13. State your hypotheses (include both Ho and H1).
A: Given that Data of X= Number of hours slept before exam Data of Y=Number of correct answers on…
Q: The average life of an electric rice cooker is 5 years, with a standard deviation of 1 year. Assume…
A: Given that. X~N( μ , ?^2 ) μ=5 , ?=1 , n=9 Z-score =( x - μ )/?
Q: he drug Ritalin is designed to stimulate the central nervous system. In a random sample of 252 boys…
A: Solution: Given information: n= 252 Sample size of boysx = 44 boys taking Ritalin p^= xn=44252=…
Q: 69% of all bald eagles survive their first year of life. Give your answers as decimals, not…
A: Result If np≥10 and nq≥10, then we will used approximate normal distribution Note: According to…
Q: The following data consists of daily COVID-19 cases rate for 55 states in United States on 28 Feb…
A: Let 'X' be the random variable represents the daily COVID-19 cases rate. Sample size (n) = 55 States…
Q: 1) Under what conditions would a researcher choose to use a t-test for independent samples? 2) Under…
A: Solution-: (1) Under what conditions would a researcher choose to use a t-test for independent…
Q: 1. Copemnan et al. (1995) examined 21 microsatellite marker loci in 445 human families with type 1…
A:
Q: A real estate agent needs to estimate the average value of a residential property of a given area in…
A: From the provided information, Sample size (n) = 225 Sample mean (x̄) = 200 Standard deviation (s) =…
Q: A food processing plant fills snack-sized bags of crackers. The mean number of crackers in each bag…
A: We have given that Mean = 22 Standard deviation = 2 Sample size = 24
Q: A previous student of this class was curious about the relationship between number of hours a person…
A: Solution: Given data
Q: Explain how random numbers could be produced from the pdf fU) = {4y°e-y*, o<y 0< y 0, otherwise…
A:
Q: A box contains 1 red marble and 99 blues; 100 marbles are drawn at random with replacement. (a)…
A:
Q: In a study on the likeability of comedians, 10 participants observed one of two comedians (one who…
A:
Q: Q/ In the vehicle speed test, the results are given in the table below: Find 1. Arithmetic mean 2.…
A: Arithmetic mean is given by, Mean= Σfx/Σf Where Xi's are mid values of class Intervals. X f…
Q: Given that the 84% confidence interval for the waiting time (in minutes) of emergency room patients…
A: We have given the following statement About the confidence interval.
Q: c.) What is the positive critical value that corresponds to an 82% confidence level? (round to the…
A:
Q: If we have a data set containing the age and marital status of large group of individuals and we ask…
A: Independent samples t test: The independent samples t-test can be used to examine a possible…
Q: State the alternative hypotheses for the following claim: Although Americans account for only 4% of…
A: Solution
Q: Exercise 6: Read and answer the following. Show your solutions. 1. In a normal distribution, 95.4%…
A: As per our guidelines we are supposed to answer only 3 sub-parts of any questions so i am solving…

Step by step
Solved in 2 steps

- Question 5 (c) How does the size of the data set help cut down on the size of the error terms in the approximation process?Calculate the PRESS statistic for the model developed from the estimation data in Problem 11.2. How well is the model likely to predict? Compare this indication of predictive performance with the actual performance observed in Problem 11.2.The following table shows the length, in centimeters, of the humerus and the total wingspan, in centimeters, of several pterosaurs, which are extinct flying reptiles. (A graphing calculator is recommended.) (a) Find the equation of the least-squares regression line for the data. (Where × is the independent variable.) Round constants to the nearest hundredth. y= ? (b) Use the equation from part (a) to determine, to the nearest centimeter, the projected wingspan of a pterosaur if its humerus is 52 centimeters. ? cm
- The operations manager of a musical instrument distributor feels that the demand for Bass Drums may be related to the number of television appearances by the popular rick group Green Shades during the previous month. The manager has collected the data shown in the following table. Demand for Bass Drums 3 6 7 5 10 8 Green Shades TV appearances 3 4 7 6 8 5 Develop the linear regression equation to forecast. Forecast demand for Bass Drums when Green Shades’ TV appearances are 10. Compute MSE and standard deviation for Problem 8.problem 1 A local health centre noted that in a sample of 400 patients, 80 were referred to them by the localhospital.a. Provide a 95% confidence interval for all the patients who are referred to the health centre bythe hospital. b.What sample size would be required to estimate the proportion of all hospital referrals to thehealth centre with a margin of error of 0.04 or less at 95% confidence? problem 2 The data in the table below presents the hourly quantity of production for three lines of productionprocesses over the first 4 days in XYZ Company. Answer the questions based on the Excel Output givenbelow. Day Process 1 Process 2 Process 31 33 33 282 30 35 363 28 30 304 29 38 34 a.State the null and alternative hypothesis for single factor ANOVA.b. State the decision rule (α = 0.05).c. Calculate the test statistic. d. Make a decision.An agent for a residential real estate company in a large city would like to be able to predict the monthly rental cost for apartments, based on the size of an apartment, as defined by square footage. The agent selects a sample of 25 apartments in a particular residential neighborhood and gathers the following data a. Construct a scatter plot. b. Use the least-squares method to determine the regression coefficients b0 and b1 c. Interpret the meaning of and in this problem. d. Predict the monthly rent for an apartment that has 1,000 square feet
- Although the Excel regression output, shown in Figure 12.21 for Demonstration Problem 12.1, is somewhat different from the Minitab output, the same essential regression features are present. The regression equation is found under Coefficients at the bottom of ANOVA. The slope or coefficient of x is 2.2315 and the y-intercept is 30.9125. The standard error of the estimate for the hospital problem is given as the fourth statistic under Regression Statistics at the top of the output, Standard Error = 15.6491. The r2 value is given as 0.886 on the second line. The t test for the slope is found under t Stat near the bottom of the ANOVA section on the “Number of Beds” (x variable) row, t = 8.83. Adjacent to the t Stat is the p-value, which is the probability of the t statistic occurring by chance if the null hypothesis is true. For this slope, the probability shown is 0.000005. The ANOVA table is in the middle of the output with the F value having the same probability as the t statistic,…Problem 1: In 2008, data from the Center for Disease Control revealed that 28.5% of all male teenagers, aged 18-19 and attending U.S. colleges were overweight. The definition of overweight is a body mass index (BMI) of over 25. In 2019, a professor in public health at a major university wanted to determine whether that proportion had decreased since 2008. So, he sampled 800 randomly selected incoming male freshman at universities around the country. Using the BMI measurements, he found that 210 of them were overweight. Test the professor’s claim at an α = 0.05 level of significance, the proportion of obese male teenagers in American colleges decreased. Make sure that any necessary assumptions for conducting the hypothesis test are satisfied. A) State the null and alternative hypothesis. H0: Ha: B) Determine the critical value(s) for the test. C) Compute the test statistic (show…For items 1 - 5, use the data below that gives the humerus bone length (in cm) and height (in inches) for a sample of female skeletons. [The data was provided by Dr. Ayers-Darling, former professor at MVCC.] humerus (cm) height (in.) 32.6 66 28.0 60 29.9 62 30.5 63 31.2 64 29.9 62 29.1 61 29.5 62 29.8 62 28.5 61 Find the slope of the least-squares regression line that relates humerus length to female height. Express its value to three decimal places (to the nearest thousandth).__________________________ Find the y-intercept of the least-squares regression line that relates humerus length to female height. Express its value to three decimal places (to the nearest thousandth).___________________________ The least-squares regression line relating two variables x and y is given by . Find the predicted value of y if x is 2.___________
- Problem 3 addressed the cross-sectional variation in the number of financial analysts who follow a company. in that problem, company size and debt-to-equity ratios were the in- dependent variables. you receive a suggestion that membership in the S&P 500 index should be added to the model as a third independent variable; the hypothesis is that there is greater demand for analyst coverage for stocks included in the S&P 500 because of the widespread use of the S&P 500 as a benchmark. a. write a multiple regression equation to test whether analyst following is systematically higher for companies included in the S&P 500 index. also include company size and debt-to-equity ratio in this equation. use the notations below. (analyst following)i = natural log of (1 + number of analysts following company i) Sizei = natural log of the market capitalization of company i in millions of dollars (d/e)i = debt-to-equity ratio for company i S&Pi = inclusion of company i in the S&P…Question 2 Ignore the term "maximum likelihood"Problem 3: Please answer parts a, b, and c! A sample of 136 hypertensive people were given an anti-hypertensive drug, and the drug was found to be effective in 49 of those people. (By effective, we mean that their diastolic blood pressure is lowered by at least 10 mm Hg as judged from a repeat measurement taken 1 month after taking the drug.) (a) Find a 90% confidence interval for the true proportion of the sampled population for which the drug is effective. (b) Using the results from the above mentioned survey, how many people should be sampled to estimate the true proportion of hypertensive people for which the drug is effective to within 4% with 96% confidence? (c) If no previous estimate of the sample proportion is available, how large of a sample should be used in (b)?