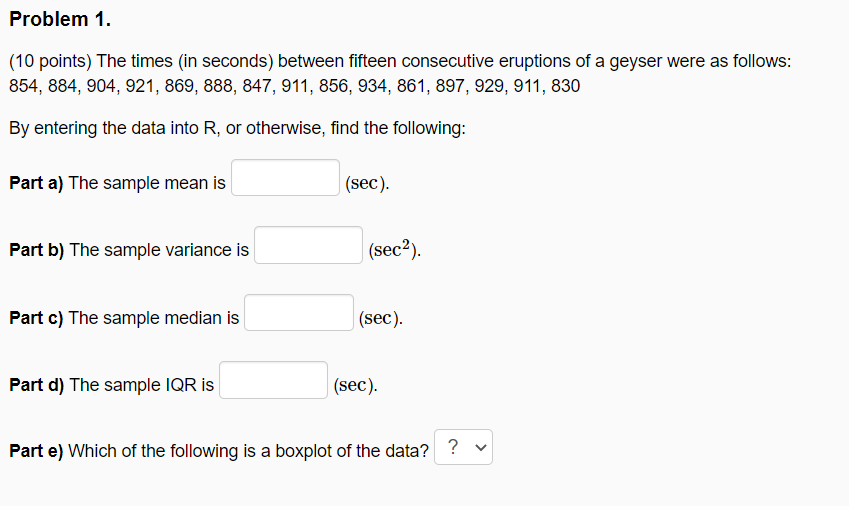
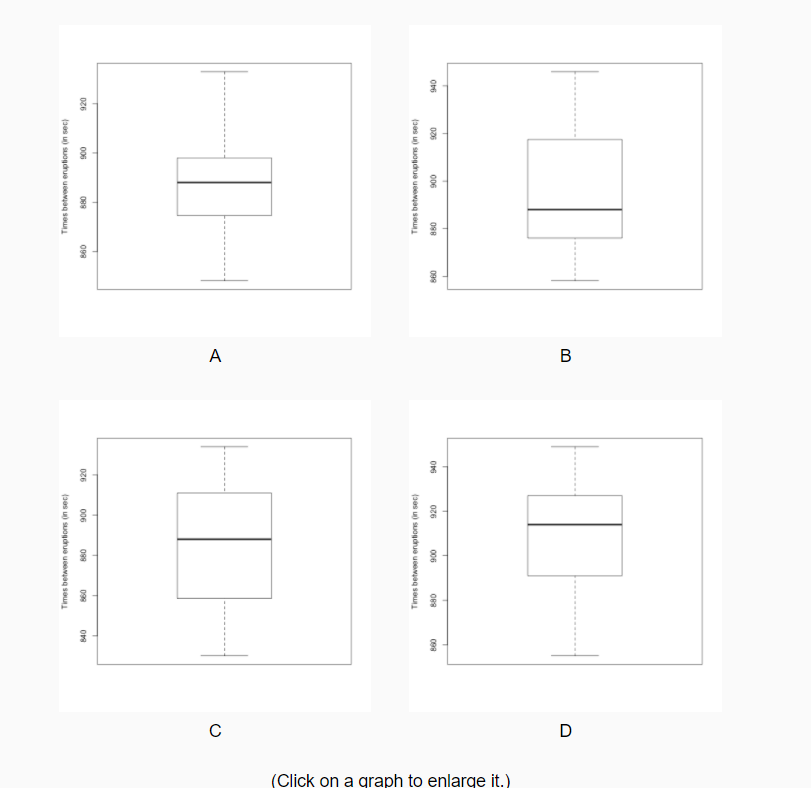
Problem 1. (10 points) The times (in seconds) between fifteen consecutive eruptions of a geyser were as follows: 854, 884, 904, 921, 869, 888, 847, 911, 856, 934, 861, 897, 929, 911, 830 By entering the data into R, or otherwise, find the following: Part a) The sample mean is (sec). Part b) The sample variance is |(sec²). Part c) The sample median is (sec). Part d) The sample IQR i | (sec). Part e) Which of the following is a boxplot of the data? ? v


Inverse Normal Distribution
The method used for finding the corresponding z-critical value in a normal distribution using the known probability is said to be an inverse normal distribution. The inverse normal distribution is a continuous probability distribution with a family of two parameters.
Mean, Median, Mode
It is a descriptive summary of a data set. It can be defined by using some of the measures. The central tendencies do not provide information regarding individual data from the dataset. However, they give a summary of the data set. The central tendency or measure of central tendency is a central or typical value for a probability distribution.
Z-Scores
A z-score is a unit of measurement used in statistics to describe the position of a raw score in terms of its distance from the mean, measured with reference to standard deviation from the mean. Z-scores are useful in statistics because they allow comparison between two scores that belong to different normal distributions.


Trending now
This is a popular solution!

Step by step
Solved in 2 steps with 1 images


