Problem 2 Below is information related to: historical average processing times for Products A and B historical percentage of work center load required to produce Produdcts A and B routing and standard times to produce Product B the product structure for Product B a MPS covering 3 periods for Products A and B. MPS in Units End Product 2 3 Processing Time End Product Hours/Unit A 50 45 25 wc Historical % B. 30 25 30 100 40% A 0.80 200 50% B 1.6 300 10% B Routing and Standard Time Data End Product Lot Size Work Center Set Up (Hrs) Run Time/Unit (Hrs)| Hrs/Unit 40 100 1 1.25 E D (3 required) D 50 200 0.07 E 100 200 2 0.08 F 100 300 2 0.04 (2 required) A. Develp a rough cut capacity plan for the three work centers based on historical factors. Please fill in the table below with your final calculations. Show your work in the space below. Historical Total Work Center Percentage 1 3 Hours 100 200 300 Total Required Capacity
Problem 2 Below is information related to: historical average processing times for Products A and B historical percentage of work center load required to produce Produdcts A and B routing and standard times to produce Product B the product structure for Product B a MPS covering 3 periods for Products A and B. MPS in Units End Product 2 3 Processing Time End Product Hours/Unit A 50 45 25 wc Historical % B. 30 25 30 100 40% A 0.80 200 50% B 1.6 300 10% B Routing and Standard Time Data End Product Lot Size Work Center Set Up (Hrs) Run Time/Unit (Hrs)| Hrs/Unit 40 100 1 1.25 E D (3 required) D 50 200 0.07 E 100 200 2 0.08 F 100 300 2 0.04 (2 required) A. Develp a rough cut capacity plan for the three work centers based on historical factors. Please fill in the table below with your final calculations. Show your work in the space below. Historical Total Work Center Percentage 1 3 Hours 100 200 300 Total Required Capacity

Practical Management Science
6th Edition
ISBN:9781337406659
Author:WINSTON, Wayne L.
Publisher:WINSTON, Wayne L.
Chapter4: Linear Programming Models
Section: Chapter Questions
Problem 111P

Related questions
Question
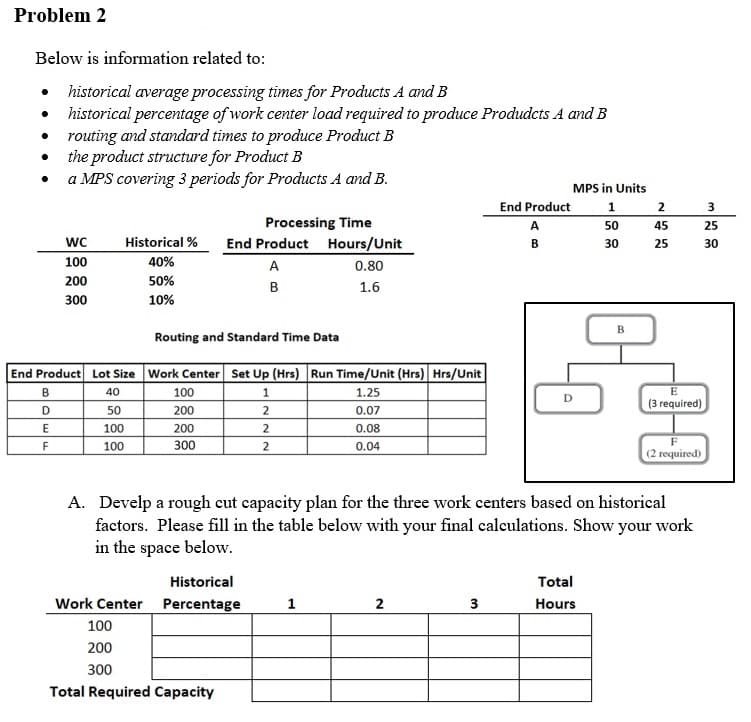
Transcribed Image Text:Problem 2
Below is information related to:
historical average processing times for Products A and B
historical percentage of work center load required to produce Produdcts A and B
routing and standard times to produce Product B
the product structure for Product B
a MPS covering 3 periods for Products A and B.
MPS in Units
End Product
2
3
Processing Time
End Product Hours/Unit
A
50
45
25
wc
Historical %
B.
30
25
30
100
40%
A
0.80
200
50%
B
1.6
300
10%
B
Routing and Standard Time Data
End Product Lot Size Work Center Set Up (Hrs) Run Time/Unit (Hrs)| Hrs/Unit
40
100
1
1.25
E
D
(3 required)
D
50
200
0.07
E
100
200
2
0.08
F
100
300
2
0.04
(2 required)
A. Develp a rough cut capacity plan for the three work centers based on historical
factors. Please fill in the table below with your final calculations. Show your work
in the space below.
Historical
Total
Work Center Percentage
1
3
Hours
100
200
300
Total Required Capacity
Expert Solution
This question has been solved!
Explore an expertly crafted, step-by-step solution for a thorough understanding of key concepts.

This is a popular solution!

Trending now
This is a popular solution!

Step by step
Solved in 4 steps with 3 images

Recommended textbooks for you
Practical Management Science
Operations Management
ISBN:
9781337406659
Author:
WINSTON, Wayne L.
Publisher:
Cengage,
Practical Management Science
Operations Management
ISBN:
9781337406659
Author:
WINSTON, Wayne L.
Publisher:
Cengage,