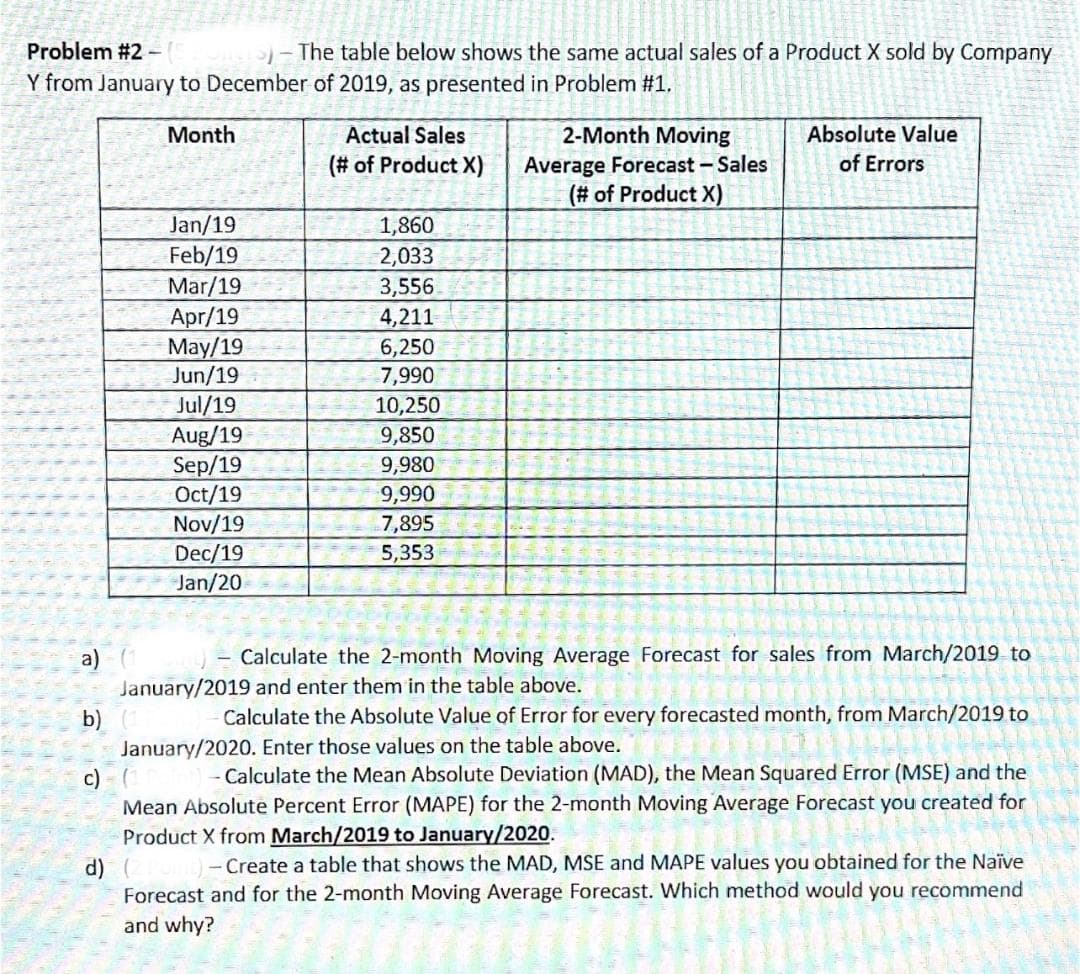
Problem #2 - - The table below shows the same actual sales of a Product X sold by Company Y from January to December of 2019, as presented in Problem #1. Month Actual Sales 2-Month Moving Absolute Value Average Forecast - Sales (# of Product X) (# of Product X) of Errors Jan/19 1,860 Feb/19 2,033 Mar/19 Apr/19 May/19 Jun/19 Jul/19 Aug/19 Sep/19 Oct/19 Nov/19 Dec/19 Jan/20 3,556 4,211 6,250 7,990 10,250 9,850 9,980 9,990 7,895 5,353 Calculate the 2-month Moving Average Forecast for sales from March/2019 to a) January/2019 and enter them in the table above. Calculate the Absolute Value of Error for every forecasted month, from March/2019 to b) January/2020. Enter those values on the table above. c) Mean Absolute Percent Error (MAPE) for the 2-month Moving Average Forecast you created for Product X from March/2019 to January/2020. - Calculate the Mean Absolute Deviation (MAD), the Mean Squared Error (MSE) and the - Create a table that shows the MAD, MSE and MAPE values you obtained for the Naïve d) Forecast and for the 2-month Moving Average Forecast. Which method would you recommend and why?
Problem #2 - - The table below shows the same actual sales of a Product X sold by Company Y from January to December of 2019, as presented in Problem #1. Month Actual Sales 2-Month Moving Absolute Value Average Forecast - Sales (# of Product X) (# of Product X) of Errors Jan/19 1,860 Feb/19 2,033 Mar/19 Apr/19 May/19 Jun/19 Jul/19 Aug/19 Sep/19 Oct/19 Nov/19 Dec/19 Jan/20 3,556 4,211 6,250 7,990 10,250 9,850 9,980 9,990 7,895 5,353 Calculate the 2-month Moving Average Forecast for sales from March/2019 to a) January/2019 and enter them in the table above. Calculate the Absolute Value of Error for every forecasted month, from March/2019 to b) January/2020. Enter those values on the table above. c) Mean Absolute Percent Error (MAPE) for the 2-month Moving Average Forecast you created for Product X from March/2019 to January/2020. - Calculate the Mean Absolute Deviation (MAD), the Mean Squared Error (MSE) and the - Create a table that shows the MAD, MSE and MAPE values you obtained for the Naïve d) Forecast and for the 2-month Moving Average Forecast. Which method would you recommend and why?

Algebra and Trigonometry (MindTap Course List)
4th Edition
ISBN:9781305071742
Author:James Stewart, Lothar Redlin, Saleem Watson
Publisher:James Stewart, Lothar Redlin, Saleem Watson
Chapter10: Systems Of Equations And Inequalities
Section10.FOM: Focus On Modeling: Linear Programming
Problem 14P

Related questions
Question
I just need the first 3 please (:
Transcribed Image Text:Problem #2-
Y from January to December of 2019, as presented in Problem #1.
-The table below shows the same actual sales of a Product X sold by Company
Month
Actual Sales
2-Month Moving
Absolute Value
(# of Product X)
Average Forecast -Sales
(# of Product X)
of Errors
Jan/19
Feb/19
Mar/19
Apr/19
May/19
Jun/19
1,860
2,033
3,556
4,211
6,250
7,990
Jul/19
Aug/19
Sep/19
Oct/19
Nov/19
Dec/19
Jan/20
10,250
9,850
9,980
9,990
7,895
5,353
- Calculate the 2-month Moving Average Forecast for sales from March/2019 to
a)
January/2019 and enter them in the table above.
b)
January/2020. Enter those values on the table above.
c)
Mean Absolute Percent Error (MAPE) for the 2-month Moving Average Forecast you created for
Product X from March/2019 to January/2020.
d)
Forecast and for the 2-month Moving Average Forecast. Which method would you recommend
and why?
Calculate the Absolute Value of Error for every forecasted month, from March/2019 to
-Calculate the Mean Absolute Deviation (MAD), the Mean Squared Error (MSE) and the
- Create a table that shows the MAD, MSE and MAPE values you obtained for the Naïve
Expert Solution
This question has been solved!
Explore an expertly crafted, step-by-step solution for a thorough understanding of key concepts.

This is a popular solution!

Trending now
This is a popular solution!

Step by step
Solved in 2 steps

Recommended textbooks for you
Algebra and Trigonometry (MindTap Course List)
Algebra
ISBN:
9781305071742
Author:
James Stewart, Lothar Redlin, Saleem Watson
Publisher:
Cengage Learning
Algebra and Trigonometry (MindTap Course List)
Algebra
ISBN:
9781305071742
Author:
James Stewart, Lothar Redlin, Saleem Watson
Publisher:
Cengage Learning