Problem 4 Correlation Coefficient Fill in the following table and calculate the correlation coefficient.
Problem 4 Correlation Coefficient Fill in the following table and calculate the correlation coefficient.

Functions and Change: A Modeling Approach to College Algebra (MindTap Course List)
6th Edition
ISBN:9781337111348
Author:Bruce Crauder, Benny Evans, Alan Noell
Publisher:Bruce Crauder, Benny Evans, Alan Noell
Chapter5: A Survey Of Other Common Functions
Section5.4: Combining And Decomposing Functions
Problem 18E

Related questions

Question
I need to fill in the rest of the graph.
Transcribed Image Text:< illi Module 11 Vid Lecture Assig..
di Module 11 Videos: SP21: EPIDE.
W Module 11 Video Lecture Assig..
A: X
Page <
of 3
ZOOM +
Se
Q: W
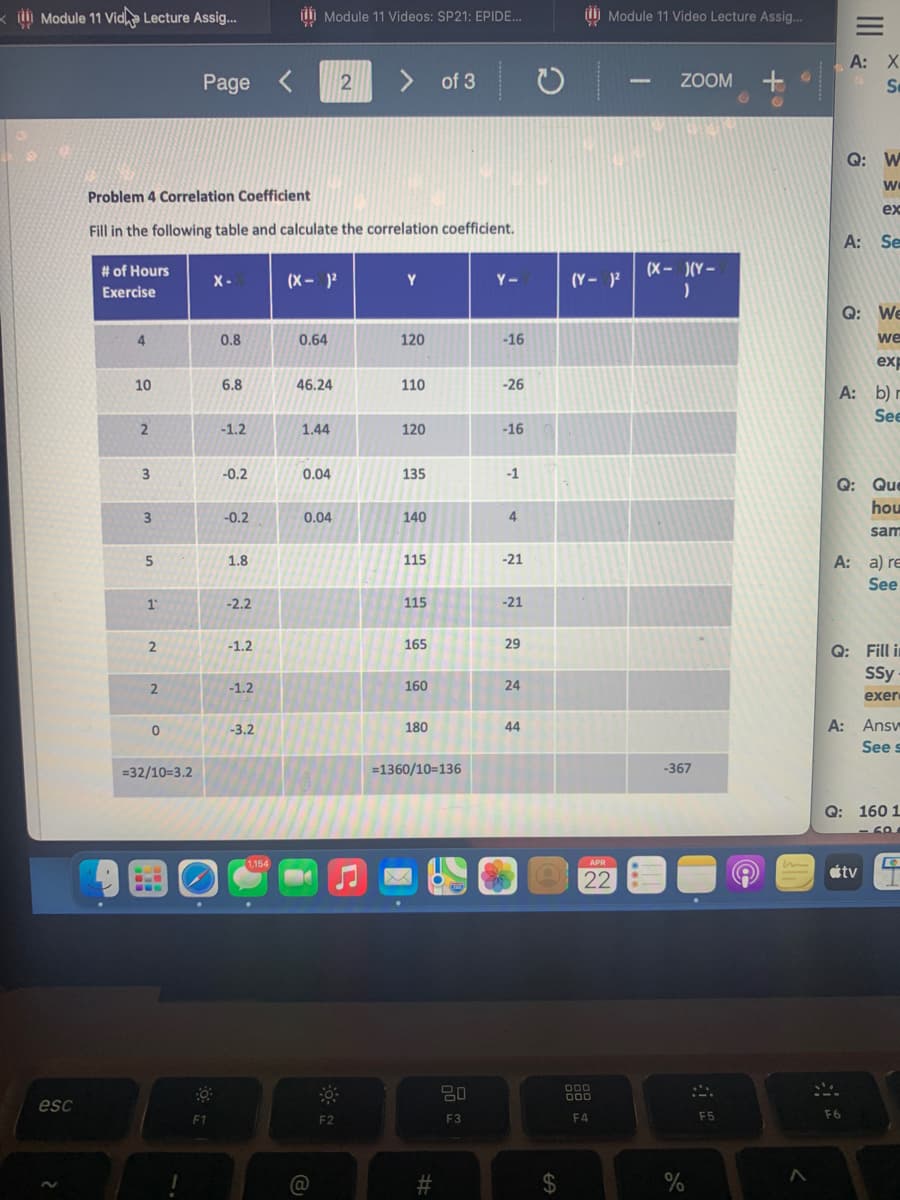
Problem 4 Correlation Coefficient
ex
Fill in the following table and calculate the correlation coefficient.
A: Se
# of Hours
(X- )(Y -
X-
(X- )
Y
Y-
(Y- )?
Exercise
Q: We
4.
0.8
0.64
120
-16
we
exp
10
6.8
46.24
110
-26
A: b) r
Se
2
-1.2
1.44
120
-16
-0.2
0.04
135
-1
Q: Que
hou
3
-0.2
0.04
140
4
sam
1.8
115
-21
A: a) re
See
-2.2
115
-21
-1.2
165
29
Q: Fill in
SSy
-1.2
160
24
exer
-3.2
180
44
A: Ansv
See s
=32/10=3.2
=1360/10=136
-367
Q: 160 1
1.154
APR
étv
22
80
D00
esc
F1
F2
F3
F4
F5
F6
@
II
井
2.
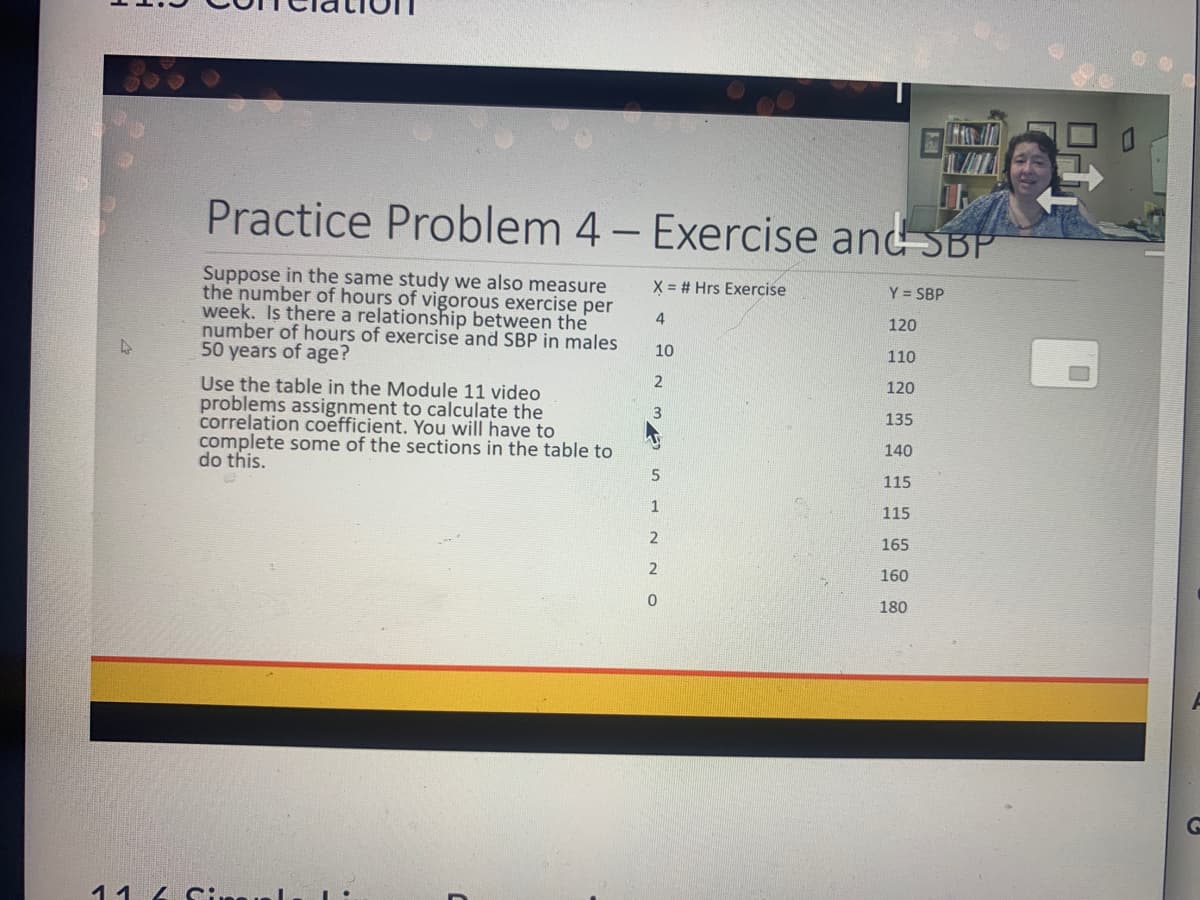
Transcribed Image Text:Practice Problem 4- Exercise and SBP
Suppose in the same study we also measure
the number of hours of vigorous exercise per
week. Is there a relationship between the
number of hours of exercise and SBP in males
50 years of age?
X = # Hrs Exercise
Y = SBP
4
120
10
110
Use the table in the Module 11 video
problems assignment to calculate the
correlation coefficient. You will have to
complete some of the sections in the table to
do this.
120
135
140
115
1
115
2
165
160
180
11 4 Si
Expert Solution
This question has been solved!
Explore an expertly crafted, step-by-step solution for a thorough understanding of key concepts.

This is a popular solution!

Trending now
This is a popular solution!

Step by step
Solved in 2 steps

Knowledge Booster


Learn more about
Need a deep-dive on the concept behind this application? Look no further. Learn more about this topic, statistics and related others by exploring similar questions and additional content below.Recommended textbooks for you
Functions and Change: A Modeling Approach to Coll…
Algebra
ISBN:
9781337111348
Author:
Bruce Crauder, Benny Evans, Alan Noell
Publisher:
Cengage Learning
Functions and Change: A Modeling Approach to Coll…
Algebra
ISBN:
9781337111348
Author:
Bruce Crauder, Benny Evans, Alan Noell
Publisher:
Cengage Learning