after checking the hypothesis tests, please explain briefly how you should proceed given the result of recent hypothesis tests and what the owner
Q: 1. Please explain the Empirical Rule. Why we cannot use Chebyshev's Theorem in Normal Distributions?…
A: Since you have asked multiple questions, we will solve the first question for you. If you want any…
Q: A company gives 4-hour boat tours for a dolphin watch. On 30 tours, the time between first leaving…
A: In question, Given the sample of size 30 with mean 125 minutes and population standard deviation is…
Q: Example 13.13 A production supervisor is interested in knowing if number of breakdowns on four ma-…
A:
Q: Data on pull-off force (pounds) for connectors used in an automobile engine application are as…
A:
Q: The grades for 30 students on the most recent exam are given in the data table below: 90 60 60 80 90…
A: Median is the middle most value. For a set of n observations, x1, x2, ... , xn with frequencies f1,…
Q: (e) Construct a 98% confidence interval for the mean flux for the pressure drop across a membrane is…
A: Use EXCEL to determine the regression equation. EXCEL procedure: Go to EXCEL Go to Data>Data…
Q: If X is a continuous random variable, what is the value of X that will be exceeded 30% of the time,…
A:
Q: Let X and Y be continuous random variables with a joint probability density function (pdf) of the…
A:
Q: A store calculates that the mean spent per order is $8.68 with a standard deviation of $2.85. What…
A:
Q: Suppose that random variables ?1 and ?2 have exponential distribution with expected value of 1 2 and…
A: Solution
Q: Part 2 Correct Answer * Incorrect. Confidence level=99%, degrees of freedom=19 i 2.861 Your Answer
A:
Q: Thoroughly describe what is happening in the image below. Relate to statistics as much as possible.…
A: The objective is to describe the given tree diagram.
Q: Chell is testing several types of boots for durability when falling a long distance. She found six…
A: Sum of squares: Sum of squares for groups: SST=∑i=16niX¯i-X¯¯2…
Q: at least 16 years of age, researchers obtained survey results summarized in the accompanying table.…
A: Solution: The observed frequency table is Drove when Drinking Alcohol Yes No Row Total…
Q: Find the value for each t. 1. n = 10 for the 90% confidence interval for the mean 2. n = 15 for…
A: Given1)n=10confidence interval = 90%
Q: Aaliyah wants to know if there is a difference between the proportions of customers who just order…
A:
Q: Executives at a car dealership want to estimate the average age of their custome before making a…
A: Margin of error
Q: An article in The Engineer ("Redesign for Suspect Wiring." June 1990) reported the results of an…
A:
Q: 1. Find the following for the following in the table: Range of data in the table Quartile deviation…
A: Since you have posted a question with multiple subparts, we will solve first 3 sub-parts for you…
Q: in a tyre manufacturing company, an industry statistician has declared that 2,5 % of the tyres…
A:
Q: firm must decide whether to construct a small, medium or large stamping plant. A consultant’s report…
A:
Q: the reduction in systolic blood pressure is 46.5 for a sample of size 20 and standard deviation…
A: We have given that, Sample mean (x̄) = 46.5, standard deviation (s) = 14.9 and sample size (n) = 20…
Q: An article in the Journal of the American Ceramic Society, "Rapid Hot-Pressing of Ultrafine PSZ…
A: Given βo^=55.626 β1^=-0.03416
Q: Matthew wants to estimate the mean fat content of a pack of potato chips manufactured by UniBee…
A: Given,standard deviation(σ)=1.2margin of error(E)=0.5α=1-0.90=0.1α2=0.05Z0.05=1.645 (from…
Q: Confidence level-99%, degrees of freedom=19 JE
A:
Q: The proportion of the stationary supply sold during the month is a beta random variable with a = 4…
A: Let X denote the proportion of the stationary supply sold during a month. Given that X follows Beta…
Q: (Constant) Salary Working Conditio B Coefficients .139 .056 are Std. Error 171 .065 003 Coefficients…
A: Dependent Variable Satisfaction Independent Variables salary working condition…
Q: Please use the accompanying Excel data set or accompanying Text file data set when completing the…
A:
Q: Explain briefly how you should proceed given the result of recent hy
A: Testing for Interaction term of pesticides and application method: H0: There is no effect due to…
Q: and respectively. Assume that X₁ and X₂ are independent of each other. Find i) The joint density…
A:
Q: A poll was conducted to investigate opinions about global warming. The respondents who answered yes…
A: There are two categorical variables which are sex and choice for the cause of global warming. We…
Q: A family of pdf's that has been used to approximate the distribution of income, city population…
A:
Q: 7. Let X₁, X2, ..., Xn be a random sample from normal distribution with mean and standard deviation…
A:
Q: After eating, they decided to go home because they still had to answer the 20 multiple-choice…
A:
Q: Q4/4:The following data represent the number of damaged pieces of spare parts for the production of…
A:
Q: This is my output from SPSS [attatched] and I need to make a results section for it for this study:…
A: T test is used to measure the mean significance exist between the sample and the population. It…
Q: Let X and Y be continuous random variables with a joint probability density function (pdf) of the…
A:
Q: 2. The following data represent the lifetimes (in hours) of a sample of 40 transistors: 112, 121,…
A: A frequency distribution is a tabular, listed or graphical representation of data that shows the…
Q: Given that the moment generating function of a random variable X is e/2, using the Maclaurin series,…
A: Please find the solution below. Thank you
Q: Model 1 (Constant) Salary Working Conditio n Personal Growth Recognition a. Dependent Variable:…
A: Given: Coefficient p value Intercept 0.139 0.42 salary 0.056 0.391 working condition…
Q: What can you say about autocorrelation of the residual? normality of the residuals? and the variance…
A: We can see from the first graph, there is positive autocorrelation. An autocorrelation plot is…
Q: In a randomized controlled trial, insecticide-treated bednets were tested as a way to reduce…
A: There are two independent samples which are infants using bed nets and infants not using bed nets.…
Q: ow many ways can the positions of center midfielder, striker, and center back be assigned from the…
A: In a soccer team of 10, there will be 2 strikers, 2 mid fielders and 2 center backs.
Q: A technician discovered that the cumulative distribution function (CDF) of the lifespan of bulb in…
A: Introduction: Expectation : The expectation of continuous random variable is calculated by…
Q: From the SAS output, interpret the 95% confidence interval for the true average difference in dental…
A: 95% confidence interval for the true average difference in dental measurements in the population of…
Q: 1. A manager states that the average number of days per year missed by the employees in his factory…
A:
Q: Consider following MLR model. Full Model: y = = Bo + B11+ B2x2 + B3x3 + B4x4 + € Given Information:…
A: Given information: Full model: y=β0+β1·x1+β2·x2+β3·x3+β4·x4+ε n=20, SST=1950 Variables p MSE R2…
Q: 2. A jar contains 12 marbles: 4 red, 5 blue, and 3 orange. If you pull 3 marbles without…
A: The total number of marbles is 12 Red marbles=4 Blue marbles=5 Orange marbles=3 There 3 marbles are…
Q: i) Find the moment generating function of X = -cY. ii) What is the distribution of X?
A:
Q: A sample of 400 call center applicants included 180 women. Find the 99% confidence interval of the…
A: Given,n=400x=180sample proportion(p^)=xnsample…
after checking the hypothesis tests, please explain briefly how you should proceed given the result of recent hypothesis tests and what the owner should do
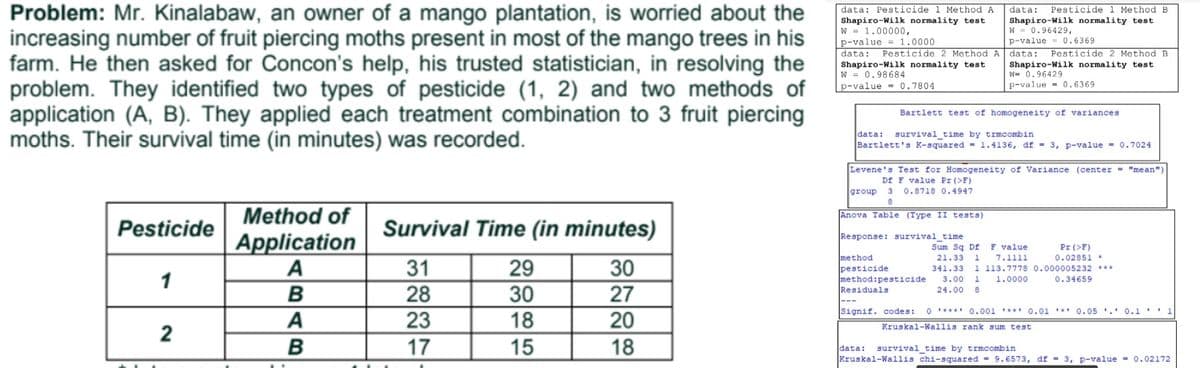
Step by step
Solved in 3 steps
- How can we know that the sample size of A is less than B? The sample size of both is not stated in the problem. Thanks!Suppose you are to design an experiment for the following problems, identify the independent variable(IV), dependent variable (DV), two to three constant factors and the possible control (NEGATIVE OR POSITIVE) to be used in the experiment. 4. What is the effect of the amount of time spent on social media on a person’s anxiety level?Problem: ________________________________________________a. IV ________________________________________________b. DV _______________________________________________c. Constant __________________________________________d. Control Group ______________________________________ 5. Do rice plants grow faster in saline water compared to pure water? Problem: ________________________________________________a. IV ________________________________________________b. DV _______________________________________________c. Constant __________________________________________d. Control Group ______________________________________ Example: 1. Does the type of glue affects…A company has two chemist, Mr. Morris and Mr. Logan to produce their drinks. Mr. John, their boss, is not pleased with Mr. Logan’s attitude to work, so he is contemplating firing Mr. Logan andkeeping Mr. Morris only to perform this job. The problem, however, is that Mr. Logan seems to produce a higher quality drink whenever he oversees production when compared to Mr. Morris. Before making a final decision, Mr. John decided to collect data measuring the quality of different batches ofdrinks produced by Mr. Morris and Mr. Logan to make a better-informeddecision. The results, measured on a quality scale, are listed below: Name Average Standard Deviation Sample Size Mr. Logan 98 1 8 Mr. Morris 94 4 10 a) Based on this data above, advise Mr. John whether Mr. Logan isbetter at making the signature sauce than Mr. Morris by usinghypothesis testing – use the critical value approach with a level ofsignificance at 5%.
- Suppose we take a sample of 2,500 blood donors from a population for which 50% (0.5) have type O+ blood. (a) Into what range of possible values should the sample proportion fall 95% of the time, according to the Empirical Rule? to (b) If the sample included only 625 donors instead of 2,500, would the range of possible sample proportions be wider, more narrow, or the same as with a sample of 2,500 donors? Explain your answer, and explain why it makes intuitive sense. The range would be with 625 donors compared to a sample of 2,500 donors since the standard deviation of the sampling distribution would be . This makes intuitive sense because if fewer donors are included in the sample, the proportion will be reliable as an estimate of the proportion.The main trial in problem 7 is conducted and involves a total of 200 patients. Patients are enrolled and randomized to receive either the experimental medication or the placebo. The data shown below is collected at the end of the study after 6 weeks on the assigned treatment. Test if there is a significant difference in the proportions of hypertensive patients between groups using a=0.05A researcher wants to know why individuals in Community A have a higher rate of a rare form of cancer when compared to those living in Community B. To find out the reasons for the differences in cancer rates in these two communities, the investigator surveyed residents about their lifestyle, noted the types of businesses that were present in the community and searched medical records. The researcher found that the headquarters for the Toxico Chemical Plant is located in Community A, there is a higher rate of cigarette smoking in this community and residents tended to delay or skip going to the doctor for an annual checkup. In Community B, the largest employer was a department store and on average, residents did not smoke as much as residents from Community A. However, like individuals from Community A, Community B residents tended to delay or skip their annual checkup with their doctor. 1. What makes this a descriptive study?
- Suppose that weights of college mathematics textbooks in the United States are normally distributed with mean µ = 2.25 lbs and variance σ2 = 0.2025 lbs. Find the weight that corresponds to Q3 and interpret this measure of position in the context of the problem.The management of BCD Inc. would like to separate the fixed and variable components of electricity as measured against machine hours in one of its plants. Data collected over the most recent six months follow:Electricity MachineMonth Cost Hours January $1,100 4,500February 1,110 4,700March 1,050 4,100April 1,200 5,000May 1,060 4,000June 1,120 4,600Required: 1. Using the method of least squares, compute the fixed cost and the variable cost rate for electricity expense. (Round estimates to the nearest cent.) 2. Compute coefficients of correlation and determinationA company claims that its brand of dish detergent, A, is more effective than a competitor’s brand, B. Fifty dirty dishes are randomly selected and randomly divided into two groups. In one group, each dirty dish will be placed in a container of hot water with Brand A detergent and in the other group, each dirty dish will be placed in a container of hot water with Brand B detergent. The dishes will sit for two hours, and then the cleanliness of the dishes will be measured using a scale of 1–10 (1 = least clean to 10 = most clean). The difference in mean cleanliness ratings for the two detergents (A – B) will then be calculated. What is the appropriate inference procedure?
- What are the advantages of conducting experiments with more than two groups or conditions?A company is testing a new drug and wants to determine what is the most effective dose in reducing the size of cancerous tumors. The company randomly select a sample of 32 individuals and randomly assigns them into 4 groups of 8 each. One group get 5mg of drug x, a second group get 10mg, a third group gets 15 mg, and the fourth group gets 20mg. After two months the company finds the average size of the tumors to be 40mm, 37mm, 26mm, and 12mm for each group, respectively. (1) State the null and alternative hypotheses for this study (2) What is the dependent and independent variable for this study (3) What test statistic/hypothesis test would you select to determine if the means are significantly difference at the alpha .05 level? (4) What critical value would you use to make your decision to reject or retain the null hypothesis at alpha .05?When we use a least-squares line to predict y values for x values beyond the range of x values found in the data, are we extrapolating or interpolating? Are there any concerns about such predictions?