Problem Set Lesson 5 1. Determine whether or not the following graphs represent two quantities that are proportional to each other. Explain your reasoning. Donated Money vs. Donations Matched Age vs. Admission Price by Benefactor 400 200 100 100 200 400 500 123 4S Money Donated Age (years) Extra Credit vs. Number of Problems 12 Number of Problems Solved Extra Ced Points Donations Matched by Benefactor (5) Admission Price (S)
Problem Set Lesson 5 1. Determine whether or not the following graphs represent two quantities that are proportional to each other. Explain your reasoning. Donated Money vs. Donations Matched Age vs. Admission Price by Benefactor 400 200 100 100 200 400 500 123 4S Money Donated Age (years) Extra Credit vs. Number of Problems 12 Number of Problems Solved Extra Ced Points Donations Matched by Benefactor (5) Admission Price (S)

Mathematics For Machine Technology
8th Edition
ISBN:9781337798310
Author:Peterson, John.
Publisher:Peterson, John.
Chapter20: Ratio And Propor Tion
Section: Chapter Questions
Problem 44A

Related questions
Question
100%
Transcribed Image Text:Problem Set
Lesson 5
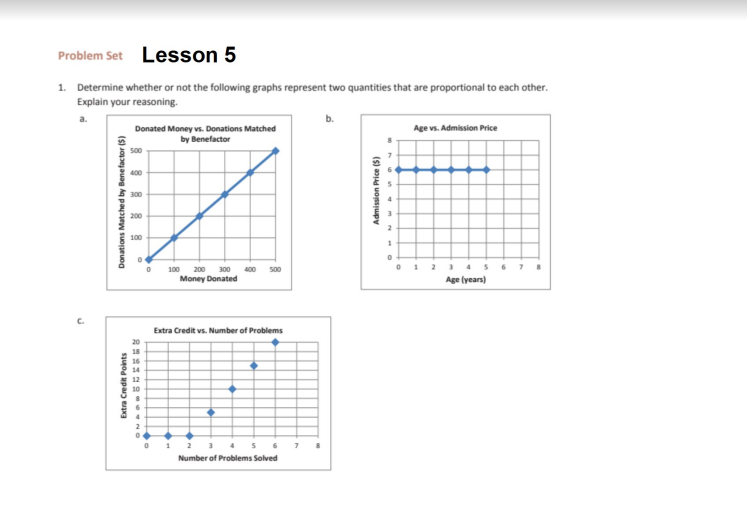
1. Determine whether or not the following graphs represent two quantities that are proportional to each other.
Explain your reasoning.
Donated Money vs. Donations Matched
by Benefactor
Age vs. Admission Price
500
400
300
200
100
2
345 6 7 8
100 200 300
400
50
Money Donated
Age (years)
Extra Credit vs. Number of Problems
1
2
3 4 5 6 7
Number of Problems Solved
Extra Credit Points
Donations Matched by Benefactor (5)
Admission Price (S)
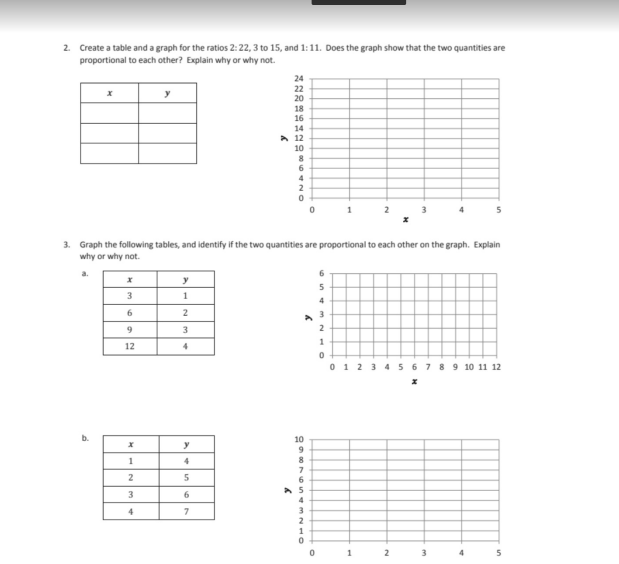
Transcribed Image Text:2. Create a table and a graph for the ratios 2:22, 3 to 15, and 1:11. Does the graph show that the two quantities are
proportional to each other? Explain why or why not.
24
22
20
18
16
14
A 12
10
2
3
4
3. Graph the following tables, and identify if the two quantities are proportional to each other on the graph. Explain
why or why not.
a.
6
y
5
3
6
2
9
3
1
12
0 1 2 3
8 9 10 11 12
10
y
4
2
3
6.
4
2
3
m210
Expert Solution
This question has been solved!
Explore an expertly crafted, step-by-step solution for a thorough understanding of key concepts.

This is a popular solution!

Trending now
This is a popular solution!

Step by step
Solved in 2 steps with 1 images

Recommended textbooks for you
Mathematics For Machine Technology
Advanced Math
ISBN:
9781337798310
Author:
Peterson, John.
Publisher:
Cengage Learning,

Holt Mcdougal Larson Pre-algebra: Student Edition…
Algebra
ISBN:
9780547587776
Author:
HOLT MCDOUGAL
Publisher:
HOLT MCDOUGAL

Trigonometry (MindTap Course List)
Trigonometry
ISBN:
9781305652224
Author:
Charles P. McKeague, Mark D. Turner
Publisher:
Cengage Learning
Mathematics For Machine Technology
Advanced Math
ISBN:
9781337798310
Author:
Peterson, John.
Publisher:
Cengage Learning,
Holt Mcdougal Larson Pre-algebra: Student Edition…
Algebra
ISBN:
9780547587776
Author:
HOLT MCDOUGAL
Publisher:
HOLT MCDOUGAL
Trigonometry (MindTap Course List)
Trigonometry
ISBN:
9781305652224
Author:
Charles P. McKeague, Mark D. Turner
Publisher:
Cengage Learning

Elementary Geometry For College Students, 7e
Geometry
ISBN:
9781337614085
Author:
Alexander, Daniel C.; Koeberlein, Geralyn M.
Publisher:
Cengage,