QUESTION 7 What type of graph would you used to describe the variable "Age"? O A histogram because "Age" is a quantitative value. A histogram because "Age" is a qualitative value. O A bar graph because "Age" is a quantitative value. O A bar graphs because "Age" is a qualitative value.
QUESTION 7 What type of graph would you used to describe the variable "Age"? O A histogram because "Age" is a quantitative value. A histogram because "Age" is a qualitative value. O A bar graph because "Age" is a quantitative value. O A bar graphs because "Age" is a qualitative value.

Holt Mcdougal Larson Pre-algebra: Student Edition 2012
1st Edition
ISBN:9780547587776
Author:HOLT MCDOUGAL
Publisher:HOLT MCDOUGAL
Chapter11: Data Analysis And Probability
Section11.2: Box-and-whisker Plots
Problem 2E

Related questions
Question
Transcribed Image Text:Gmail
YouTube Maps
nes
Noticias Traducir
* Question Completion Status:
O A bar graphs because "Program of Study" is a qualitative value.
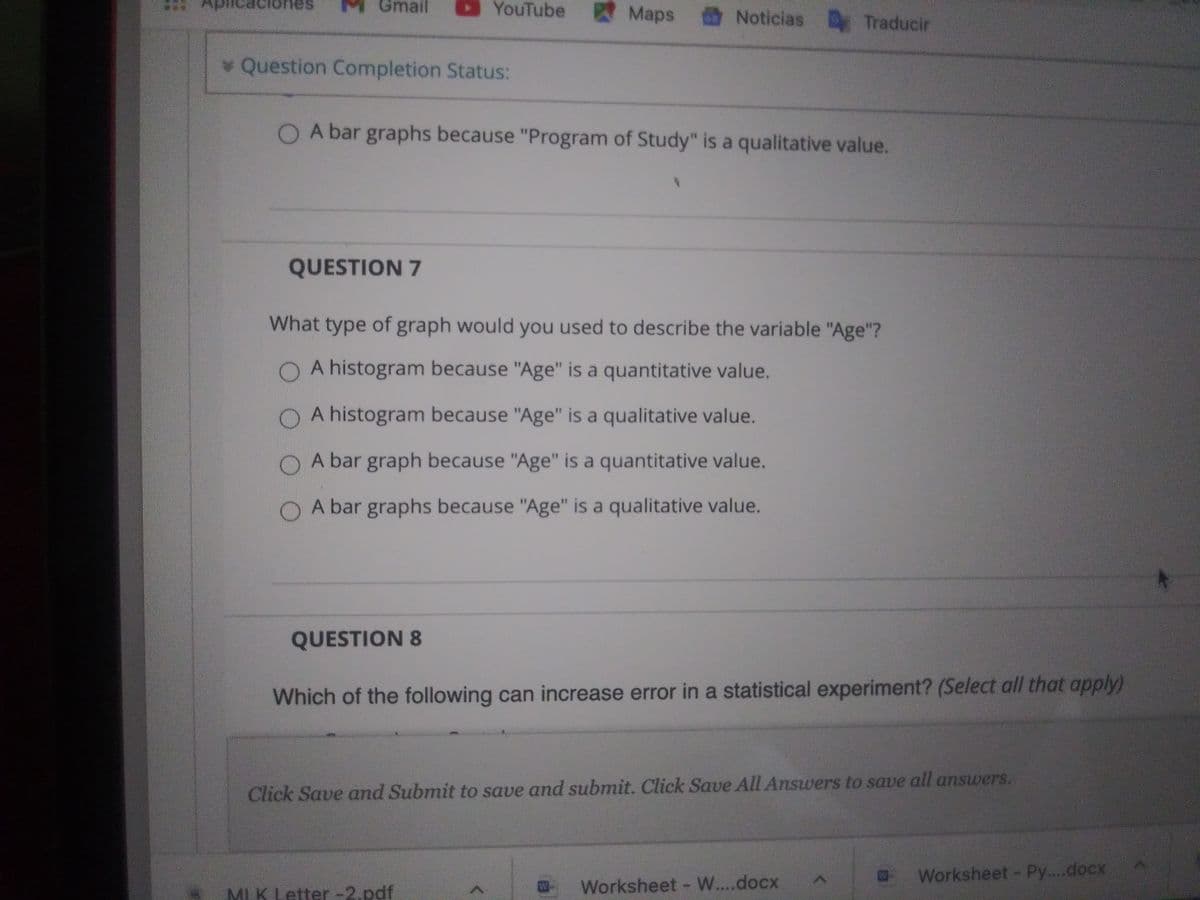
QUESTION 7
What type of graph would you used to describe the variable "Age"?
O A histogram because "Age" is a quantitative value.
O A histogram because "Age" is a qualitative value.
O A bar graph because "Age" is a quantitative value.
O A bar graphs because "Age" is a qualitative value.
QUESTION 8
Which of the following can increase error in a statistical experiment? (Select all that apply)
Click Save and Submit to save and submit. Click Save All Answers to save all answers.
Worksheet Py....docx
Worksheet W....docx
MI.K Letter -2.pdf
Expert Solution
This question has been solved!
Explore an expertly crafted, step-by-step solution for a thorough understanding of key concepts.

This is a popular solution!

Trending now
This is a popular solution!

Step by step
Solved in 2 steps

Recommended textbooks for you
Holt Mcdougal Larson Pre-algebra: Student Edition…
Algebra
ISBN:
9780547587776
Author:
HOLT MCDOUGAL
Publisher:
HOLT MCDOUGAL
Holt Mcdougal Larson Pre-algebra: Student Edition…
Algebra
ISBN:
9780547587776
Author:
HOLT MCDOUGAL
Publisher:
HOLT MCDOUGAL