Produce a CROSSTAB for the variables CLASS and RECYCLE. Before conducting your analysis, first reverse code SATJOB so that 1 = Very Dissatisfied; 2=Moderately Dissatisfied; 3=Moderately Satisfied; and 4=Very satisfied. Set all other values (8, 9) to system missing. Then examine the relationship between social class and job satisfaction by testing both statistical significance and strength of association. Use chi-square for significance and choose

MATLAB: An Introduction with Applications
6th Edition
ISBN:9781119256830
Author:Amos Gilat
Publisher:Amos Gilat
Chapter1: Starting With Matlab
Section: Chapter Questions
Problem 1P
icon
Related questions
Question

Produce a CROSSTAB for the variables CLASS and RECYCLE. Before conducting your analysis, first reverse code SATJOB so that 1 = Very Dissatisfied; 2=Moderately Dissatisfied; 3=Moderately Satisfied; and 4=Very satisfied. Set all other values (8, 9) to system missing. Then examine the relationship between social class and job satisfaction by testing both statistical significance and strength of association. Use chi-square for significance and choose the appropriate measures for strength of association (Phi, Cramer’s V, Lambda, or Gamma). Set alpha to .05.

State the null and research hypotheses:

H0:

H1:

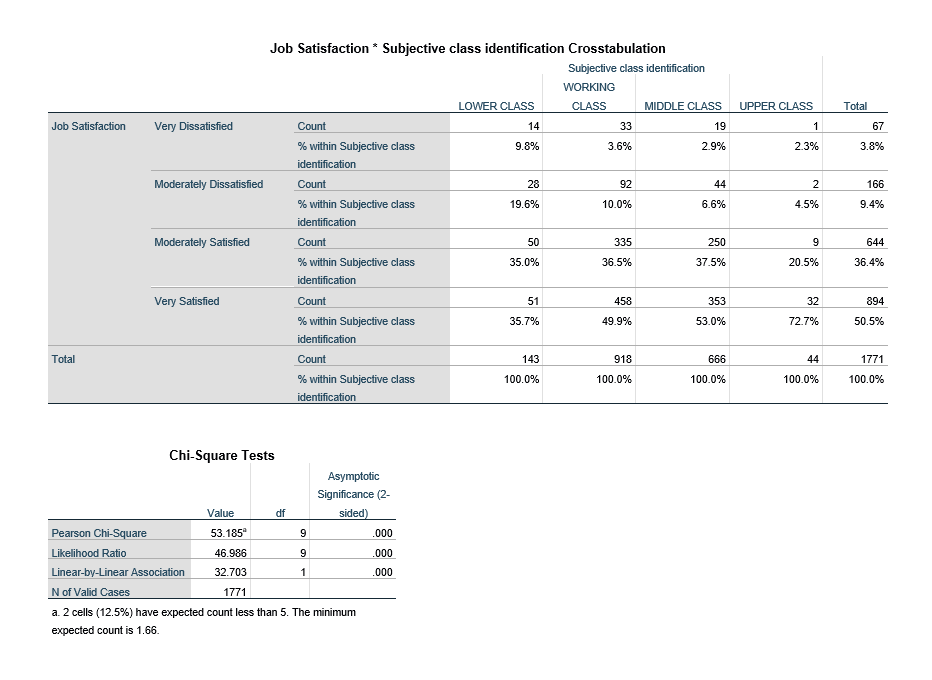
What is the obtained chi-square value?

What is the significance level (p-value) for the obtained chi-square?

Should we reject or fail to reject the null hypothesis?

Is there a statistically significant relationship between these variables?

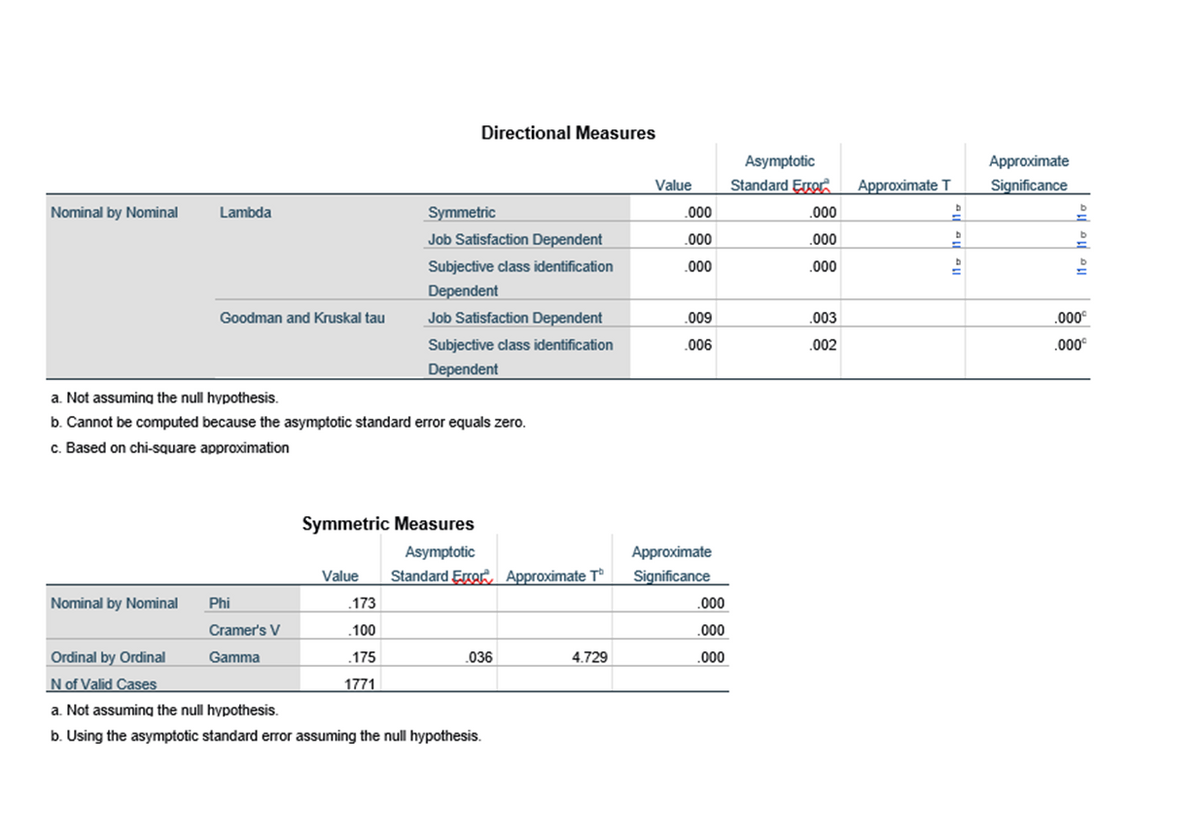
Which measure of association would be most appropriate for these variables?

What is the value of the measure of association?

Interpret your findings by explaining in full sentences whether there is a statistically significant relationship or not and the strength of the relationship. Also explain any patterns you see in the percentages:

Job Satisfaction * Subjective class identification Crosstabulation
Subjective class identification
WORKING
LOWER CLASS
CLASS
MIDDLE CLASS
UPPER CLASS
Total
Job Satisfaction
Very Dissatisfied
Count
14
33
19
1
67
% within Subjective class
9.8%
3.6%
2.9%
2.3%
3.8%
identification
Moderately Dissatisfied
Count
28
92
44
2
166
% within Subjective class
19.6%
10.0%
6.6%
4.5%
9.4%
identification
Moderately Satisfied
Count
50
335
250
644
% within Subjective class
35.0%
36.5%
37.5%
20.5%
36.4%
identification
Very Satisfied
Count
51
458
353
32
894
% within Subjective class
35.7%
49.9%
53.0%
72.7%
50.5%
identification
Total
Count
143
918
666
44
1771
% within Subjective class
100.0%
100.0%
100.0%
100.0%
100.0%
identification
Chi-Square Tests
Asymptotic
Significance (2-
Value
df
sided)
Pearson Chi-Square
53.185
.000
Likelihood Ratio
46.986
.000
Linear-by-Linear Association
32.703
1
.000
N of Valid Cases
1771
a. 2 cells (12.5%) have expected count less than 5. The minimum
expected count is 1.66.
Transcribed Image Text:Job Satisfaction * Subjective class identification Crosstabulation Subjective class identification WORKING LOWER CLASS CLASS MIDDLE CLASS UPPER CLASS Total Job Satisfaction Very Dissatisfied Count 14 33 19 1 67 % within Subjective class 9.8% 3.6% 2.9% 2.3% 3.8% identification Moderately Dissatisfied Count 28 92 44 2 166 % within Subjective class 19.6% 10.0% 6.6% 4.5% 9.4% identification Moderately Satisfied Count 50 335 250 644 % within Subjective class 35.0% 36.5% 37.5% 20.5% 36.4% identification Very Satisfied Count 51 458 353 32 894 % within Subjective class 35.7% 49.9% 53.0% 72.7% 50.5% identification Total Count 143 918 666 44 1771 % within Subjective class 100.0% 100.0% 100.0% 100.0% 100.0% identification Chi-Square Tests Asymptotic Significance (2- Value df sided) Pearson Chi-Square 53.185 .000 Likelihood Ratio 46.986 .000 Linear-by-Linear Association 32.703 1 .000 N of Valid Cases 1771 a. 2 cells (12.5%) have expected count less than 5. The minimum expected count is 1.66.
Directional Measures
Asymptotic
Approximate
Value
Standard Ergor
Approximate T
Significance
Nominal by Nominal
Lambda
Symmetric
.000
.000
Job Satisfaction Dependent
.000
.000
Subjective class identification
.000
.000
Dependent
Goodman and Kruskal tau
Job Satisfaction Dependent
.009
003
.000
Subjective class identification
.006
.002
.000°
Dependent
a. Not assuming the null hypothesis.
b. Cannot be computed because the asymptotic standard error equals zero.
c. Based on chi-square approximation
Symmetric Measures
Asymptotic
Approximate
Value
Standard Error, Approximate T
Significance
Nominal by Nominal
Phi
.173
.000
Cramer's V
100
.000
Ordinal by Ordinal
Gamma
.175
.036
4.729
.000
N of Valid Cases
1771
a. Not assuming the null hypothesis.
b. Using the asymptotic standard error assuming the null hypothesis.
Transcribed Image Text:Directional Measures Asymptotic Approximate Value Standard Ergor Approximate T Significance Nominal by Nominal Lambda Symmetric .000 .000 Job Satisfaction Dependent .000 .000 Subjective class identification .000 .000 Dependent Goodman and Kruskal tau Job Satisfaction Dependent .009 003 .000 Subjective class identification .006 .002 .000° Dependent a. Not assuming the null hypothesis. b. Cannot be computed because the asymptotic standard error equals zero. c. Based on chi-square approximation Symmetric Measures Asymptotic Approximate Value Standard Error, Approximate T Significance Nominal by Nominal Phi .173 .000 Cramer's V 100 .000 Ordinal by Ordinal Gamma .175 .036 4.729 .000 N of Valid Cases 1771 a. Not assuming the null hypothesis. b. Using the asymptotic standard error assuming the null hypothesis.
Expert Solution
steps

Step by step

Solved in 3 steps

Blurred answer
Knowledge Booster
Anova and Design of Experiments
Learn more about
Need a deep-dive on the concept behind this application? Look no further. Learn more about this topic, statistics and related others by exploring similar questions and additional content below.
Similar questions
  • SEE MORE QUESTIONS
Recommended textbooks for you
MATLAB: An Introduction with Applications
Statistics
ISBN:
9781119256830
Author:
Amos Gilat
Publisher:
John Wiley & Sons Inc
Probability and Statistics for Engineering and th…
Statistics
ISBN:
9781305251809
Author:
Jay L. Devore
Publisher:
Cengage Learning
Statistics for The Behavioral Sciences (MindTap C…
Statistics
ISBN:
9781305504912
Author:
Frederick J Gravetter, Larry B. Wallnau
Publisher:
Cengage Learning
Elementary Statistics: Picturing the World (7th E…
Statistics
ISBN:
9780134683416
Author:
Ron Larson, Betsy Farber
Publisher:
PEARSON
The Basic Practice of Statistics
Statistics
ISBN:
9781319042578
Author:
David S. Moore, William I. Notz, Michael A. Fligner
Publisher:
W. H. Freeman
Introduction to the Practice of Statistics
Statistics
ISBN:
9781319013387
Author:
David S. Moore, George P. McCabe, Bruce A. Craig
Publisher:
W. H. Freeman