Production figures of a Textile industry are as follows : 1992 1993 1994 1995 1996 1997 1998 Year : Production (in '000 units) : 12 10 14 11 13 15 16 For the above data (i) Determine the straight line equation by change of origin under the least sauare method./
Production figures of a Textile industry are as follows : 1992 1993 1994 1995 1996 1997 1998 Year : Production (in '000 units) : 12 10 14 11 13 15 16 For the above data (i) Determine the straight line equation by change of origin under the least sauare method./

Chapter1: Equations, Inequalities, And Mathematical Modeling
Section1.1: Graphs Of Equations
Problem 9ECP

Related questions
Question
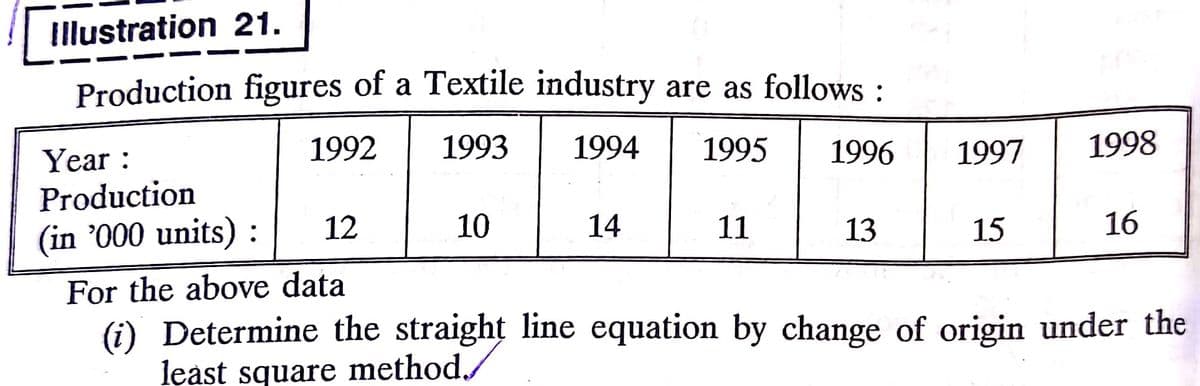
Transcribed Image Text:Illustration 21.
Production figures of a Textile industry are as follows :
1992
1993
1994
1995
1996
1997
1998
Year :
Production
(in '000 units) :
12
10
14
11
13
15
16
For the above data
(i) Determine the straight line equation by change of origin under the
least square method./
Expert Solution
This question has been solved!
Explore an expertly crafted, step-by-step solution for a thorough understanding of key concepts.

Step by step
Solved in 2 steps with 2 images

Recommended textbooks for you

Mathematics For Machine Technology
Advanced Math
ISBN:
9781337798310
Author:
Peterson, John.
Publisher:
Cengage Learning,

Algebra & Trigonometry with Analytic Geometry
Algebra
ISBN:
9781133382119
Author:
Swokowski
Publisher:
Cengage
Mathematics For Machine Technology
Advanced Math
ISBN:
9781337798310
Author:
Peterson, John.
Publisher:
Cengage Learning,
Algebra & Trigonometry with Analytic Geometry
Algebra
ISBN:
9781133382119
Author:
Swokowski
Publisher:
Cengage
