Professional Golfers' Earnings Two random samples of earnings of professional golfers were selected. One sample was taken from the Professional Golfers Association, and the other was taken from the Ladies Professional Golfers Association. At a = 0.05, is there a difference in the means? The data are in thousands of dollars. Use the critical value method with tables. PGA 446 1147 9188 10,508 4910 8553 7573 375 LPGA 48 76 122 466 863 1876 2029 4364 2921 Send data to Excel Use u, for the mean earnings of PGA golfers. Assume the variables are normally distributed and the variances are unequal. Part: 0 / 5 Part 1 of 5 State the hypotheses and identify the claim with the correct hypothesis. Ho : (Choose one) ▼ H : (Choose one) This hypothesis test is a (Choose one) ▼ test.
Professional Golfers' Earnings Two random samples of earnings of professional golfers were selected. One sample was taken from the Professional Golfers Association, and the other was taken from the Ladies Professional Golfers Association. At a = 0.05, is there a difference in the means? The data are in thousands of dollars. Use the critical value method with tables. PGA 446 1147 9188 10,508 4910 8553 7573 375 LPGA 48 76 122 466 863 1876 2029 4364 2921 Send data to Excel Use u, for the mean earnings of PGA golfers. Assume the variables are normally distributed and the variances are unequal. Part: 0 / 5 Part 1 of 5 State the hypotheses and identify the claim with the correct hypothesis. Ho : (Choose one) ▼ H : (Choose one) This hypothesis test is a (Choose one) ▼ test.

Linear Algebra: A Modern Introduction
4th Edition
ISBN:9781285463247
Author:David Poole
Publisher:David Poole
Chapter4: Eigenvalues And Eigenvectors
Section4.6: Applications And The Perron-frobenius Theorem
Problem 22EQ

Related questions
Question
100%
The first pic is the question. Since some tutors have been solving the problems wrong recently (no judgment), I’ve added a sample question to solve problem.
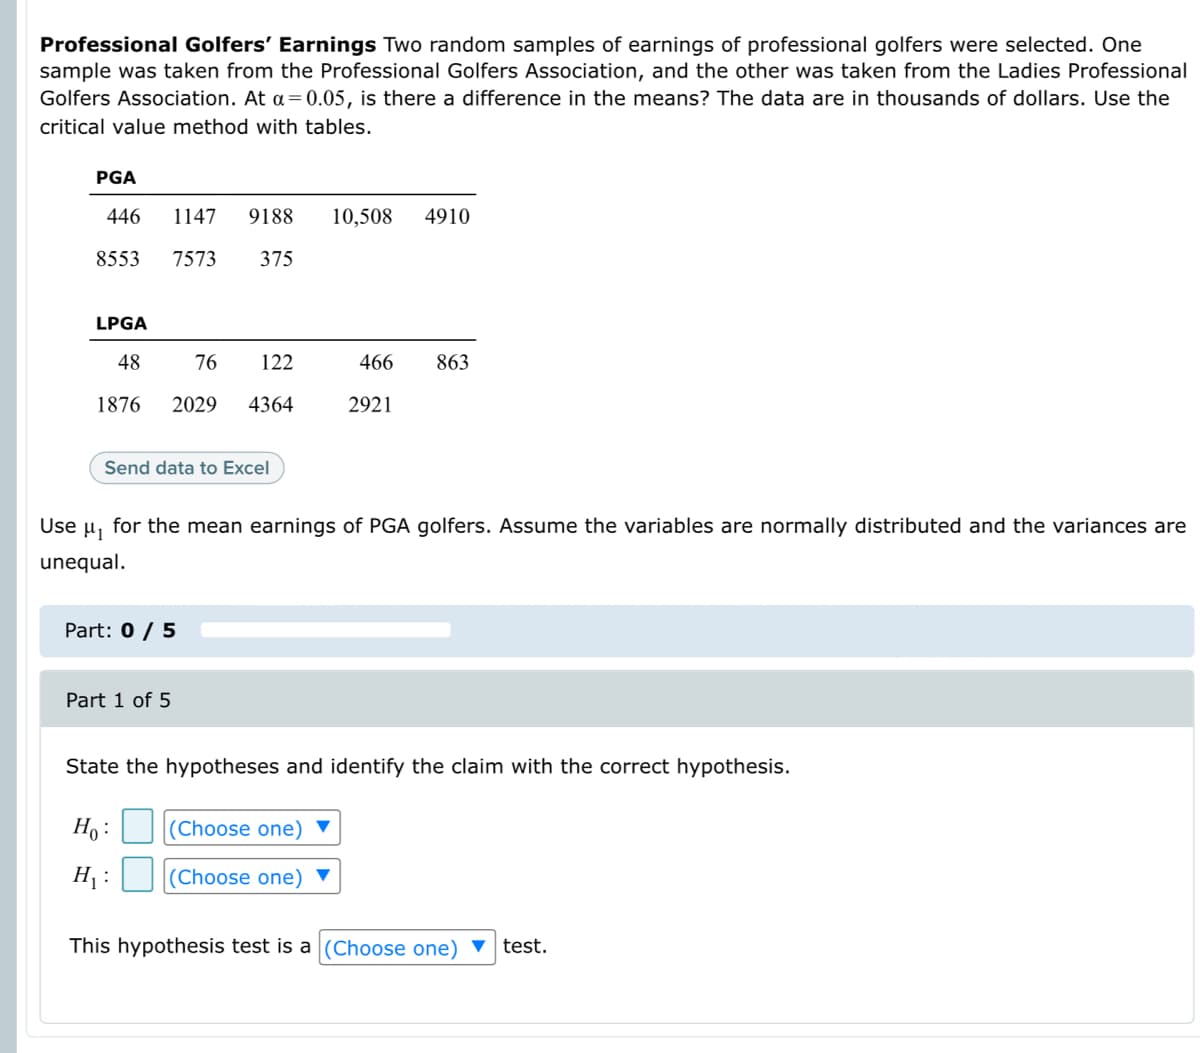
Transcribed Image Text:Professional Golfers' Earnings Two random samples of earnings of professional golfers were selected. One
sample was taken from the Professional Golfers Association, and the other was taken from the Ladies Professional
Golfers Association. At a= 0.05, is there a difference in the means? The data are in thousands of dollars. Use the
critical value method with tables.
PGA
446
1147
9188
10,508
4910
8553
7573
375
LPGA
48
76
122
466
863
1876
2029
4364
2921
Send data to Excel
Use u, for the mean earnings of PGA golfers. Assume the variables are normally distributed and the variances are
unequal.
Part: 0 / 5
Part 1 of 5
State the hypotheses and identify the claim with the correct hypothesis.
Ho :
(Choose one) ▼
H :
(Choose one)
This hypothesis test is a (Choose one) ▼
test.
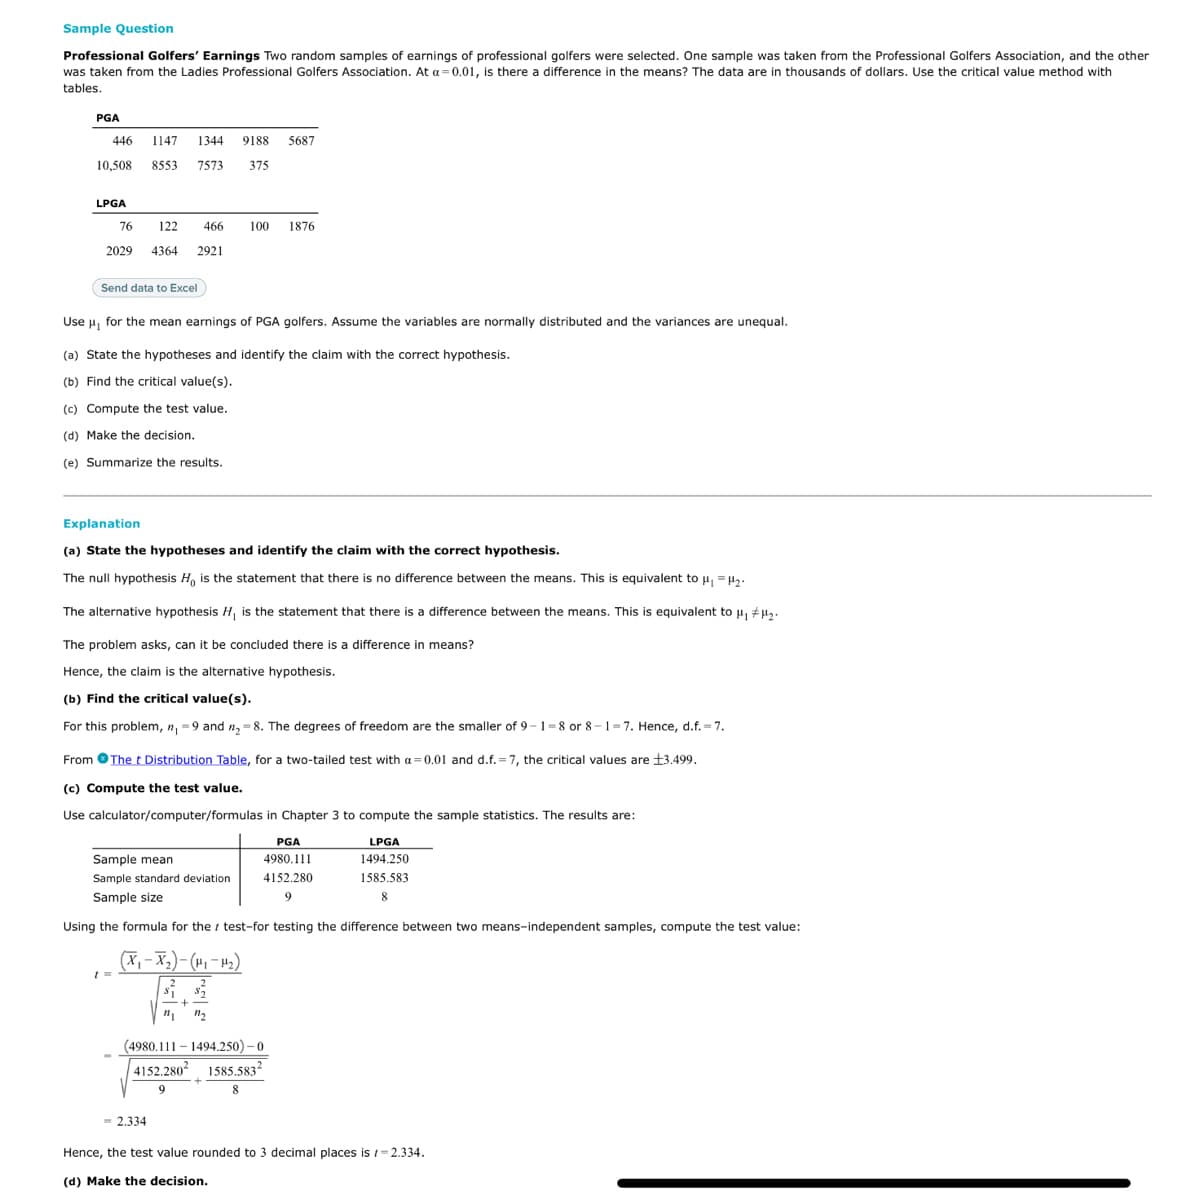
Transcribed Image Text:Sample Question
Professional Golfers' Earnings Two random samples of earnings of professional golfers were selected. One sample was taken from the Professional Golfers Association, and the other
was taken from the Ladies Professional Golfers Association. At a= 0.01, is there a difference in the means? The data are in thousands of dollars. Use the critical value method with
tables.
PGA
446 1147 1344 9188 5687
10,508
8553
7573
375
LPGA
76
122
466
100
1876
2029
4364
2921
Send data to Excel
Use u, for the mean earnings of PGA golfers. Assume the variables are normally distributed and the variances are unequal.
(a) State the hypotheses and identify the claim with the correct hypothesis.
(b) Find the critical value(s).
(c) Compute the test value.
(d) Make the decision.
(e) Summarize the results.
Explanation
(a) State the hypotheses and identify the claim with the correct hypothesis.
The null hypothesis H, is the statement that there is no difference between the means. This is equivalent to u, =H.
The alternative hypothesis H, is the statement that there is a difference between the means. This is equivalent to u, #H,.
The problem asks, can it be concluded there is a difference in means?
Hence, the claim is the alternative hypothesis.
(b) Find the critical value(s).
For this problem, n, =9 and n,= 8. The degrees of freedom are the smaller of 9 -1=8 or 8- 1=7. Hence, d.f. =7.
From OThe t Distribution Table, for a two-tailed test with a= 0.01 and d.f. = 7, the critical values are ±3.499.
(c) Compute the test value.
Use calculator/computer/formulas in Chapter 3 to compute the sample statistics. The results are:
PGA
LPGA
Sample mean
4980.111
1494.250
Sample standard deviation
4152.280
1585.583
Sample size
9
8
Using the formula for the i test-for testing the difference between two means-independent samples, compute the test value:
(X,-X,)- (H, – H2)
(4980.111 – 1494.250) – 0
4152.2802 1585.5832
9.
= 2.334
Hence, the test value rounded to 3 decimal places is t=2.334.
(d) Make the decision.
Expert Solution
This question has been solved!
Explore an expertly crafted, step-by-step solution for a thorough understanding of key concepts.

This is a popular solution!

Trending now
This is a popular solution!

Step by step
Solved in 3 steps with 3 images

Recommended textbooks for you
Linear Algebra: A Modern Introduction
Algebra
ISBN:
9781285463247
Author:
David Poole
Publisher:
Cengage Learning

Algebra and Trigonometry (MindTap Course List)
Algebra
ISBN:
9781305071742
Author:
James Stewart, Lothar Redlin, Saleem Watson
Publisher:
Cengage Learning

Functions and Change: A Modeling Approach to Coll…
Algebra
ISBN:
9781337111348
Author:
Bruce Crauder, Benny Evans, Alan Noell
Publisher:
Cengage Learning
Linear Algebra: A Modern Introduction
Algebra
ISBN:
9781285463247
Author:
David Poole
Publisher:
Cengage Learning
Algebra and Trigonometry (MindTap Course List)
Algebra
ISBN:
9781305071742
Author:
James Stewart, Lothar Redlin, Saleem Watson
Publisher:
Cengage Learning
Functions and Change: A Modeling Approach to Coll…
Algebra
ISBN:
9781337111348
Author:
Bruce Crauder, Benny Evans, Alan Noell
Publisher:
Cengage Learning

Algebra & Trigonometry with Analytic Geometry
Algebra
ISBN:
9781133382119
Author:
Swokowski
Publisher:
Cengage

Glencoe Algebra 1, Student Edition, 9780079039897…
Algebra
ISBN:
9780079039897
Author:
Carter
Publisher:
McGraw Hill

College Algebra
Algebra
ISBN:
9781305115545
Author:
James Stewart, Lothar Redlin, Saleem Watson
Publisher:
Cengage Learning