The accompanying data are lengths (inches) of bears. Find the percentile corresponding to 71.5 in. Click the icon to view the bear length data. The percentile corresponding to 71.5 in. is (Round to the nearest whole number as needed.) Bear Lengths 35.5 37.5 40.0 40.5 41.0 43.0 44.0 45.5 46.0 47.5 48.0 48.0 D 49.5 50.0 52.0 52.5 52.5 53.0 53.5 56.8 58.0 58.0 58.5 58.5 59.0 60.0 61.0 61.0 61.0 61.5 62.0 62.5 63.0 63.0 63.5 64.0 64.5 64.5 65.0 65.5 66.0 67.5 68.0 68.5 70.0 70.0 71.5 71.5 72.0 72.5 72.5 73.0 74.5 77.0
The accompanying data are lengths (inches) of bears. Find the percentile corresponding to 71.5 in. Click the icon to view the bear length data. The percentile corresponding to 71.5 in. is (Round to the nearest whole number as needed.) Bear Lengths 35.5 37.5 40.0 40.5 41.0 43.0 44.0 45.5 46.0 47.5 48.0 48.0 D 49.5 50.0 52.0 52.5 52.5 53.0 53.5 56.8 58.0 58.0 58.5 58.5 59.0 60.0 61.0 61.0 61.0 61.5 62.0 62.5 63.0 63.0 63.5 64.0 64.5 64.5 65.0 65.5 66.0 67.5 68.0 68.5 70.0 70.0 71.5 71.5 72.0 72.5 72.5 73.0 74.5 77.0

Holt Mcdougal Larson Pre-algebra: Student Edition 2012
1st Edition
ISBN:9780547587776
Author:HOLT MCDOUGAL
Publisher:HOLT MCDOUGAL
Chapter11: Data Analysis And Probability
Section: Chapter Questions
Problem 8CR

Related questions
Question
93 and 95 solve both plz
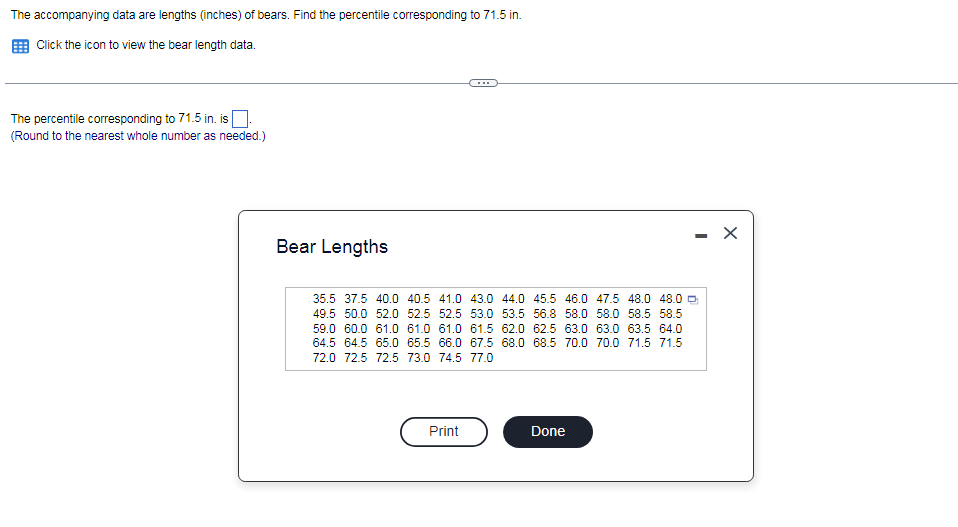
Transcribed Image Text:The accompanying data are lengths (inches) of bears. Find the percentile corresponding to 71.5 in.
Click the icon to view the bear length data.
The percentile corresponding to 71.5 in. is
(Round to the nearest whole number as needed.)
Bear Lengths
35.5 37.5 40.0 40.5 41.0 43.0 44.0 45.5 46.0 47.5 48.0 48.0 0
49.5 50.0 52.0 52.5 52.5 53.0 53.5 56.8 58.0 58.0 58.5 58.5
59.0 60.0 61.0 61.0 61.0 61.5 62.0 62.5 63.0 63.0 63.5 64.0
64.5 64.5 65.0 65.5 66.0 67.5 68.0 68.5 70.0 70.0 71.5 71.5
72.0 72.5 72.5 73.0 74.5 77.0
Print
Done
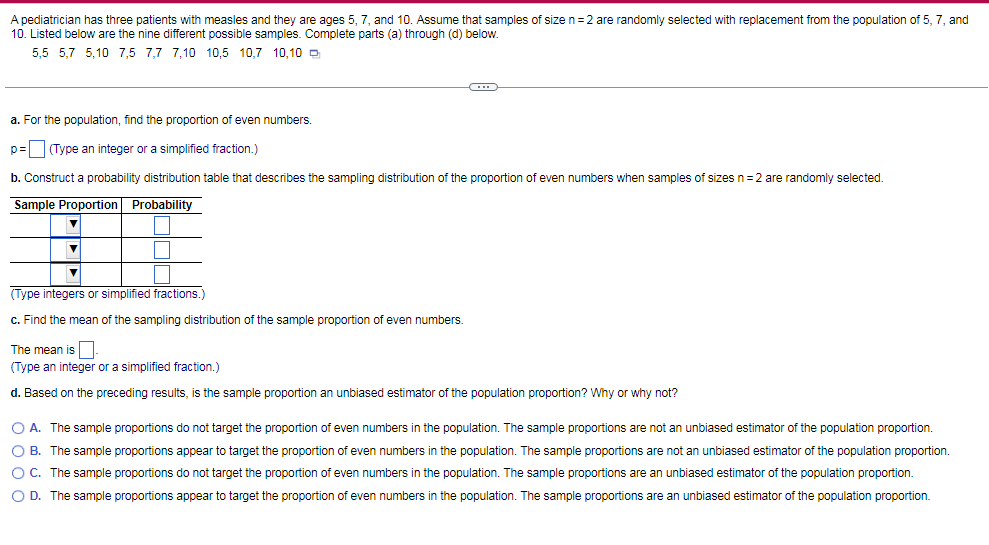
Transcribed Image Text:A pediatrician has three patients with measles and they are ages 5, 7, and 10. Assume that samples of size n=2 are randomly selected with replacement from the population of 5, 7, and
10. Listed below are the nine different possible samples. Complete parts (a) through (d) below.
5,5 5,7 5,10 7,5 7,7 7,10 10,5 10,7 10,10 D
a. For the population, find the proportion of even numbers.
p= (Type an integer or a simplified fraction.)
b. Construct a probability distribution table that describes the sampling distribution of the proportion of even numbers when samples of sizes n=2 are randomly selected.
Sample Proportion Probability
(Type integers or simplified fractions.)
c. Find the mean of the sampling distribution of the sample proportion of even numbers.
The mean is.
(Type an integer or a simplified fraction.)
d. Based on the preceding results, is the sample proportion an unbiased estimator of the population proportion? Why or why not?
O A. The sample proportions do not target the proportion of even numbers in the population. The sample proportions are not an unbiased estimator of the population proportion.
O B. The sample proportions appear to target the proportion of even numbers in the population. The sample proportions are not an unbiased estimator of the population proportion.
O C. The sample proportions do not target the proportion of even numbers in the population. The sample proportions are an unbiased estimator of the population proportion.
O D. The sample proportions appear to target the proportion of even numbers in the population. The sample proportions are an unbiased estimator of the population proportion.
Expert Solution
This question has been solved!
Explore an expertly crafted, step-by-step solution for a thorough understanding of key concepts.

This is a popular solution!

Trending now
This is a popular solution!

Step by step
Solved in 2 steps with 1 images

Recommended textbooks for you
Holt Mcdougal Larson Pre-algebra: Student Edition…
Algebra
ISBN:
9780547587776
Author:
HOLT MCDOUGAL
Publisher:
HOLT MCDOUGAL

Glencoe Algebra 1, Student Edition, 9780079039897…
Algebra
ISBN:
9780079039897
Author:
Carter
Publisher:
McGraw Hill
Holt Mcdougal Larson Pre-algebra: Student Edition…
Algebra
ISBN:
9780547587776
Author:
HOLT MCDOUGAL
Publisher:
HOLT MCDOUGAL
Glencoe Algebra 1, Student Edition, 9780079039897…
Algebra
ISBN:
9780079039897
Author:
Carter
Publisher:
McGraw Hill