Profitability Ratio) What is the Return on Asset Ratio in 2020?

Accounting (Text Only)
26th Edition
ISBN:9781285743615
Author:Carl Warren, James M. Reeve, Jonathan Duchac
Publisher:Carl Warren, James M. Reeve, Jonathan Duchac
Chapter22: Budgeting
Section: Chapter Questions
Problem 22.22EX: Capital expenditures budget On January 1, 2016, the controller of Omicron Inc. is planning capital...

Related questions
Question
(Profitability Ratio)
What is the Return on Asset Ratio in 2020?
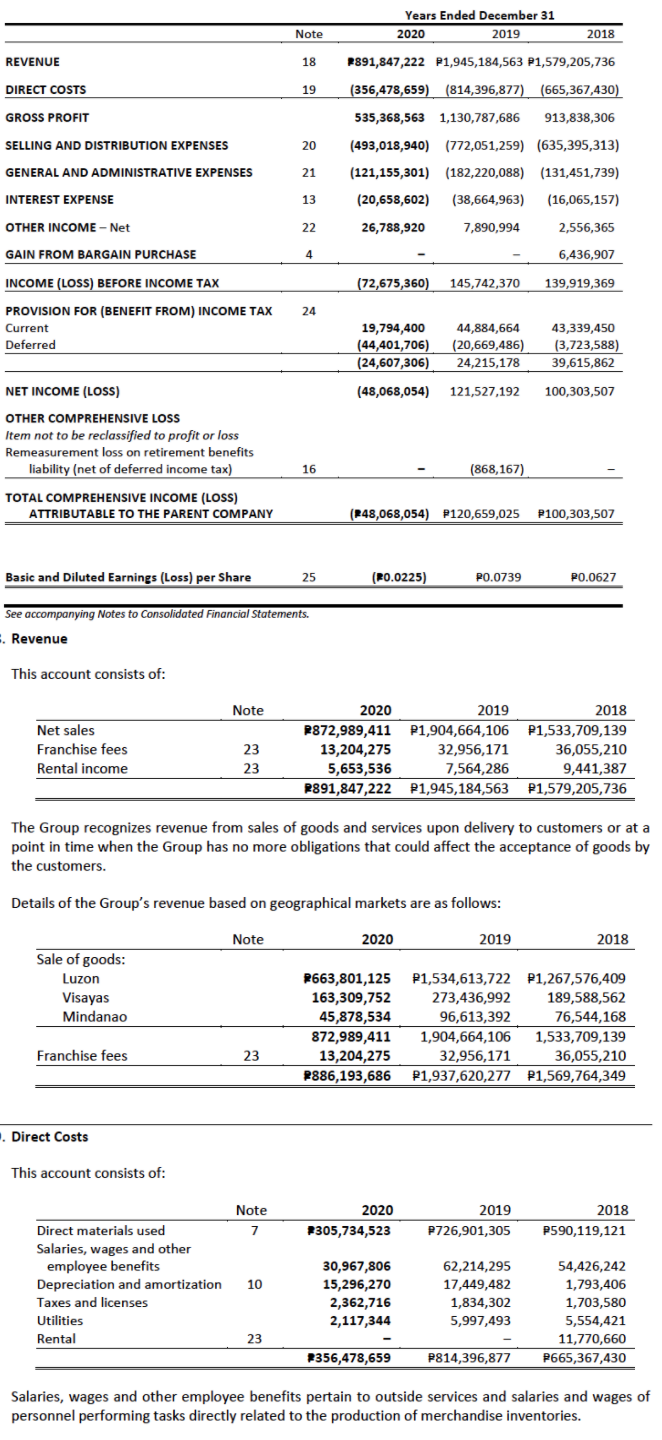
Transcribed Image Text:Years Ended December 31
Note
2020
2019
2018
REVENUE
18
P891,847,222 P1,945,184,563 P1,579,205,736
DIRECT COSTS
19
(356,478,659) (814,396,877) (665,367,430)
GROSS PROFIT
535,368,563 1,130,787,686
913,838,306
SELLING AND DISTRIBUTION EXPENSES
20
(493,018,940)
(772,051,259) (635,395,313)
GENERAL AND ADMINISTRATIVE EXPENSES
21
(121,155,301)
(182,220,088)
(131,451,739)
INTEREST EXPENSE
13
(20,658,602)
(38,664,963)
(16,065,157)
OTHER INCOME – Net
22
26,788,920
7,890,994
2,556,365
GAIN FROM BARGAIN PURCHASE
4
6,436,907
INCOME (LOSS) BEFORE INCOME TAX
(72,675,360)
145,742,370
139,919,369
PROVISION FOR (BENEFIT FROM) INCOME TAX
24
Current
19,794,400
(44,401,706)
44,884,664
43,339,450
(20,669,486)
24,215,178
Deferred
(3,723,588)
(24,607,306)
39,615,862
NET INCOME (LOSS)
(48,068,054)
121,527,192
100,303,507
OTHER COMPREHENSIVE LOSS
Item not to be reclassified to profit or loss
Remeasurement loss on retirement benefits
liability (net of deferred income tax)
16
(868,167)
TOTAL COMPREHENSIVE INCOME (LOSS)
ATTRIBUTABLE TO THE PARENT COMPANY
(248,068,054) P120,659,025
P100,303,507
Basic and Diluted Earnings (Loss) per Share
25
(P0.0225)
PO.0739
PO.0627
See accompanying Notes to Consolidated Financial Statements.
: Revenue
This account consists of:
Note
2020
2019
2018
Net sales
P872,989,411
13,204,275
5,653,536
P1,904,664,106
P1,533,709,139
Franchise fees
23
32,956,171
36,055,210
Rental income
23
7,564,286
9,441,387
P891,847,222 P1,945,184,563
P1,579,205,736
The Group recognizes revenue from sales of goods and services upon delivery to customers or at a
point in time when the Group has no more obligations that could affect the acceptance of goods by
the customers.
Details of the Group's revenue based on geographical markets are as follows:
Note
2020
2019
2018
Sale of goods:
Luzon
P663,801,125
163,309,752
45,878,534
P1,534,613,722 P1,267,576,409
273,436,992
96,613,392
Visayas
189,588,562
Mindanao
76,544,168
872,989,411
1,904,664,106
1,533,709,139
Franchise fees
23
32,956,171
P1,937,620,277 P1,569,764,349
13,204,275
36,055,210
P886,193,686
. Direct Costs
This account consists of:
Note
2020
2019
2018
Direct materials used
7
2305,734,523
P726,901,305
P590,119,121
Salaries, wages and other
employee benefits
Depreciation and amortization
30,967,806
62,214,295
54,426,242
1,793,406
1,703,580
10
15,296,270
17,449,482
2,362,716
2,117,344
Taxes and licenses
1,834,302
Utilities
5,997,493
5,554,421
Rental
23
11,770,660
2356,478,659
P814,396,877
P665,367,430
Salaries, wages and other employee benefits pertain to outside services and salaries and wages of
personnel performing tasks directly related to the production of merchandise inventories.
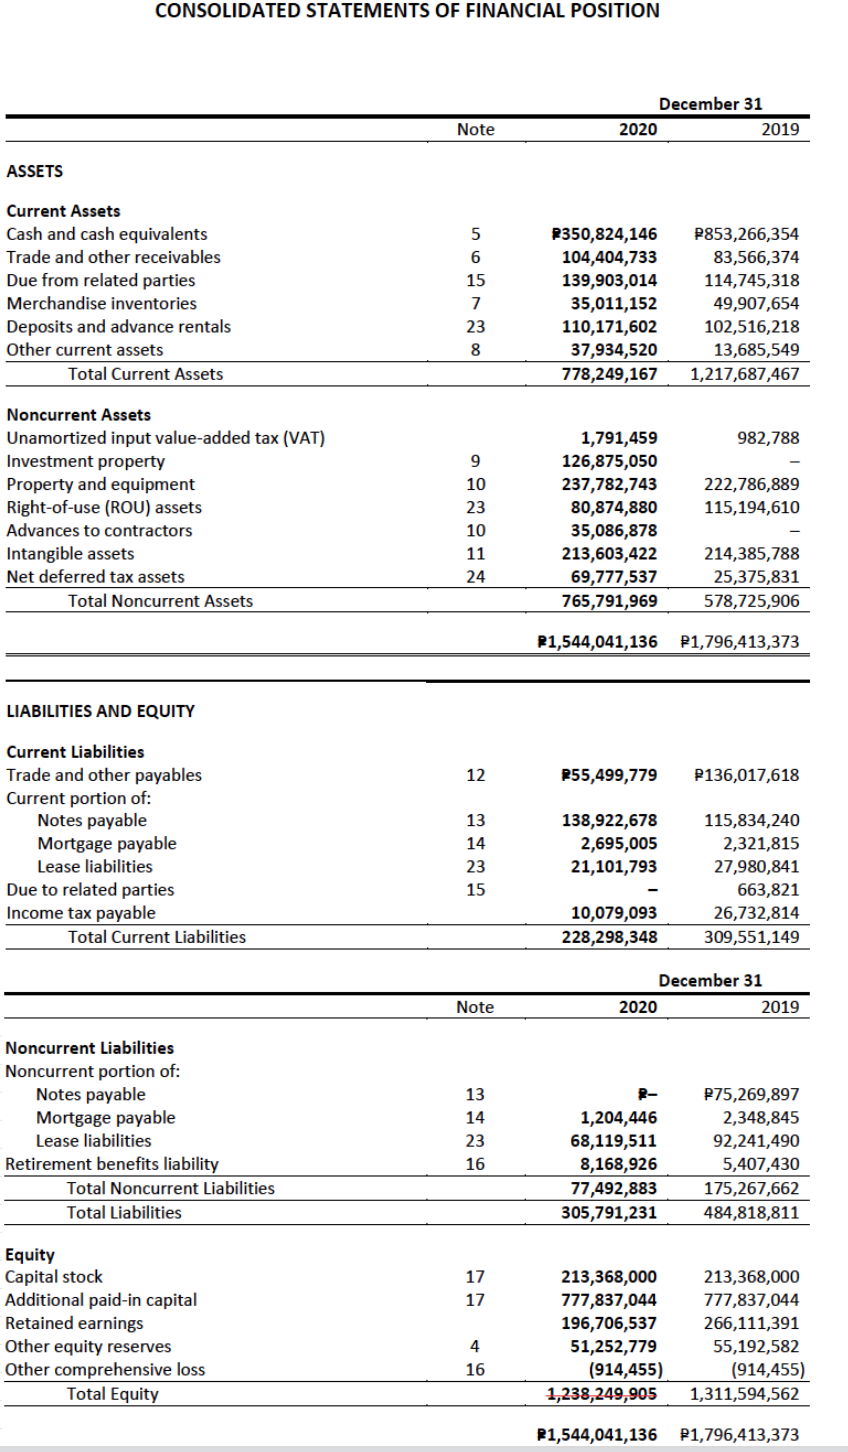
Transcribed Image Text:CONSOLIDATED STATEMENTS OF FINANCIAL POSITION
December 31
Note
2020
2019
ASSETS
Current Assets
Cash and cash equivalents
P350,824,146
P853,266,354
Trade and other receivables
104,404,733
83,566,374
Due from related parties
15
114,745,318
139,903,014
35,011,152
110,171,602
37,934,520
778,249,167
Merchandise inventories
49,907,654
Deposits and advance rentals
Other current assets
102,516,218
13,685,549
23
8
Total Current Assets
1,217,687,467
Noncurrent Assets
Unamortized input value-added tax (VAT)
Investment property
Property and equipment
Right-of-use (ROU) assets
1,791,459
126,875,050
237,782,743
982,788
222,786,889
115,194,610
10
23
80,874,880
35,086,878
213,603,422
69,777,537
Advances to contractors
10
Intangible assets
11
214,385,788
Net deferred tax assets
24
25,375,831
Total Noncurrent Assets
765,791,969
578,725,906
P1,544,041,136
P1,796,413,373
LIABILITIES AND EQUITY
Current Liabilities
Trade and other payables
Current portion of:
Notes payable
Mortgage payable
12
P55,499,779
P136,017,618
138,922,678
2,695,005
21,101,793
13
115,834,240
14
2,321,815
Lease liabilities
23
27,980,841
Due to related parties
Income tax payable
15
663,821
10,079,093
228,298,348
26,732,814
Total Current Liabilities
309,551,149
December 31
Note
2020
2019
Noncurrent Liabilities
Noncurrent portion of:
Notes payable
Mortgage payable
Lease liabilities
13
R-
P75,269,897
14
1,204,446
68,119,511
8,168,926
77,492,883
305,791,231
2,348,845
23
92,241,490
Retirement benefits liability
16
5,407,430
Total Noncurrent Liabilities
175,267,662
Total Liabilities
484,818,811
Equity
Capital stock
Additional paid-in capital
Retained earnings
Other equity reserves
Other comprehensive loss
17
213,368,000
777,837,044
213,368,000
17
777,837,044
196,706,537
266,111,391
4
51,252,779
55,192,582
(914,455)
1,238,249,905
16
(914,455)
Total Equity
1,311,594,562
P1,544,041,136 P1,796,413,373
Expert Solution
This question has been solved!
Explore an expertly crafted, step-by-step solution for a thorough understanding of key concepts.

Step by step
Solved in 2 steps with 1 images

Knowledge Booster


Learn more about
Need a deep-dive on the concept behind this application? Look no further. Learn more about this topic, accounting and related others by exploring similar questions and additional content below.Recommended textbooks for you
Accounting (Text Only)
Accounting
ISBN:
9781285743615
Author:
Carl Warren, James M. Reeve, Jonathan Duchac
Publisher:
Cengage Learning
Accounting (Text Only)
Accounting
ISBN:
9781285743615
Author:
Carl Warren, James M. Reeve, Jonathan Duchac
Publisher:
Cengage Learning