Provide an appropriate response. 37) The heights (in inches) of 20 randomly selected adult males are listed below. Test the claim that the variance is less than 6.25. Use a = 0.05. Assume the population is normally distributed. 70 72 71 70 69 73 67 71 70 74 69 68 69 68 70 71 71 71 71 72
Provide an appropriate response. 37) The heights (in inches) of 20 randomly selected adult males are listed below. Test the claim that the variance is less than 6.25. Use a = 0.05. Assume the population is normally distributed. 70 72 71 70 69 73 67 71 70 74 69 68 69 68 70 71 71 71 71 72

Glencoe Algebra 1, Student Edition, 9780079039897, 0079039898, 2018
18th Edition
ISBN:9780079039897
Author:Carter
Publisher:Carter
Chapter10: Statistics
Section10.4: Distributions Of Data
Problem 19PFA

Related questions
Question
Help
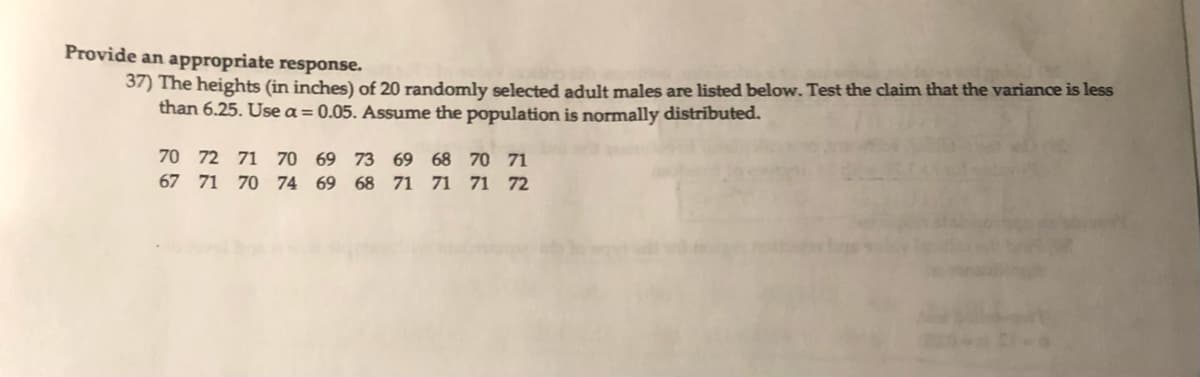
Transcribed Image Text:Provide an appropriate response.
37) The heights (in inches) of 20 randomly selected adult males are listed below. Test the claim that the variance is less
than 6.25. Use a = 0.05. Assume the population is normally distributed.
70 72 71 70 69 73
67 71 70 74 69 68
69 68 70 71
71 71 71 72
Expert Solution
This question has been solved!
Explore an expertly crafted, step-by-step solution for a thorough understanding of key concepts.

Step by step
Solved in 2 steps with 2 images

Recommended textbooks for you
Glencoe Algebra 1, Student Edition, 9780079039897…
Algebra
ISBN:
9780079039897
Author:
Carter
Publisher:
McGraw Hill
Glencoe Algebra 1, Student Edition, 9780079039897…
Algebra
ISBN:
9780079039897
Author:
Carter
Publisher:
McGraw Hill