Is there any skewness in the data? Which direction? What is the cause of the skewness? Which wines are possible outliers and why?
Is there any skewness in the data? Which direction? What is the cause of the skewness? Which wines are possible outliers and why?

MATLAB: An Introduction with Applications
6th Edition
ISBN:9781119256830
Author:Amos Gilat
Publisher:Amos Gilat
Chapter1: Starting With Matlab
Section: Chapter Questions
Problem 1P

Related questions
Question
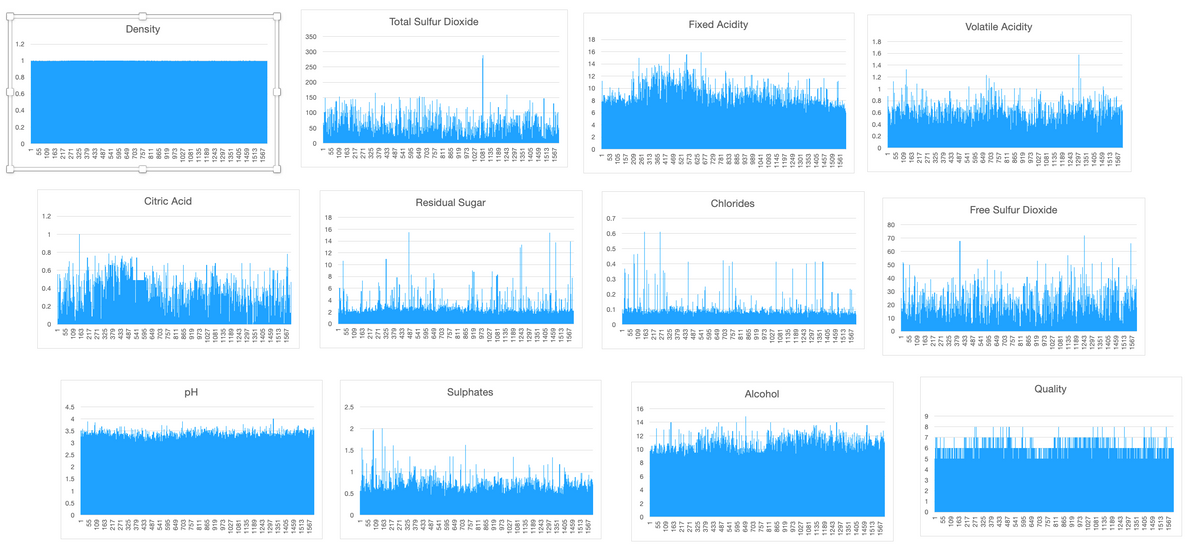
- Is there any skewness in the data? Which direction?
- What is the cause of the skewness?
- Which wines are possible outliers and why?
Transcribed Image Text:1
55
109
163
217
271
325
379
433
487
541
595
649
703
757
811
865
919
973
1027
1081
1135
1189
1243
1297
1351
1405
1459
1513
1567
1
55
109
163
217
271
325
379
433
487
541
595
649
703
757
811
865
919
973
1027
1081
1135
1189
1243
1297
1351
1405
1459
1513
1567
1
55
109
163
217
271
325
379
433
487
541
595
649
703
757
811
865
919
973
1027
1081
1135
1189
1243
1297
1351
1405
1459
1513
1567
1
55
109
163
217
271
325
379
433
487
541
595
649
703
757
811
865
919
973
1027
1081
1135
1189
1243
1297
1351
1405
1459
1513
1567
0.5
0.5
CO
ថា @
1.5
01 O
N
N
16
pH
Sulphates
Alcohol
Quality
1
55
109
163
217
271
325
379
433
487
541
595
649
703
757
811
865
919
973
1027
1081
1135
1189
1243
1297
1351
1405
1459
1513
1567
1
55
109
163
217
271
325
379
433
487
541
595
649
703
757
811
865
919
973
1027
1081
1135
1189
1243
1297
1351
1405
1459
1513
1567
1
55
109
163
217
271
325
379
433
487
541
595
649
703
757
811
865
919
973
1027
1081
1135
1189
1243
1297
1351
1405
1459
1513
1567
1
55
109
163
217
271
325
379
433
487
541
595
649
703
757
811
865
919
973
1027
1081
1135
1189
1243
1297
1351
1405
1459
1513
1567
O
N
0.2
0.6
0.8
1
1.2
18
Citric Acid
Residual Sugar
Chlorides
Free Sulfur Dioxide
1
55
109
163
217
271
325
379
433
487
541
595
649
703
757
811
865
919
973
1027
1081
1135
1189
1243
1297
1351
1405
1459
1513
1567
1
55
109
163
217
271
325
379
433
487
541
595
649
703
757
811
865
919
973
1027
1081
1135
1189
1243
1297
1351
1405
1459
1513
1567
53
105
157
209
261
313
365
417
469
521
573
625
677
729
781
833
885
937
989
1041
1093
1145
1197
1249
1301
1353
1405
1457
1509
1561
1
55
109
163
217
271
325
379
433
487
541
595
649
703
757
811
865
919
973
1027
1081
1135
1189
1243
1297
1351
1405
1459
1513
1567
0.2
0.8
0.6
0.8
1.2
250
300
350
co
Density
Total Sulfur Dioxide
Fixed Acidity
Volatile Acidity
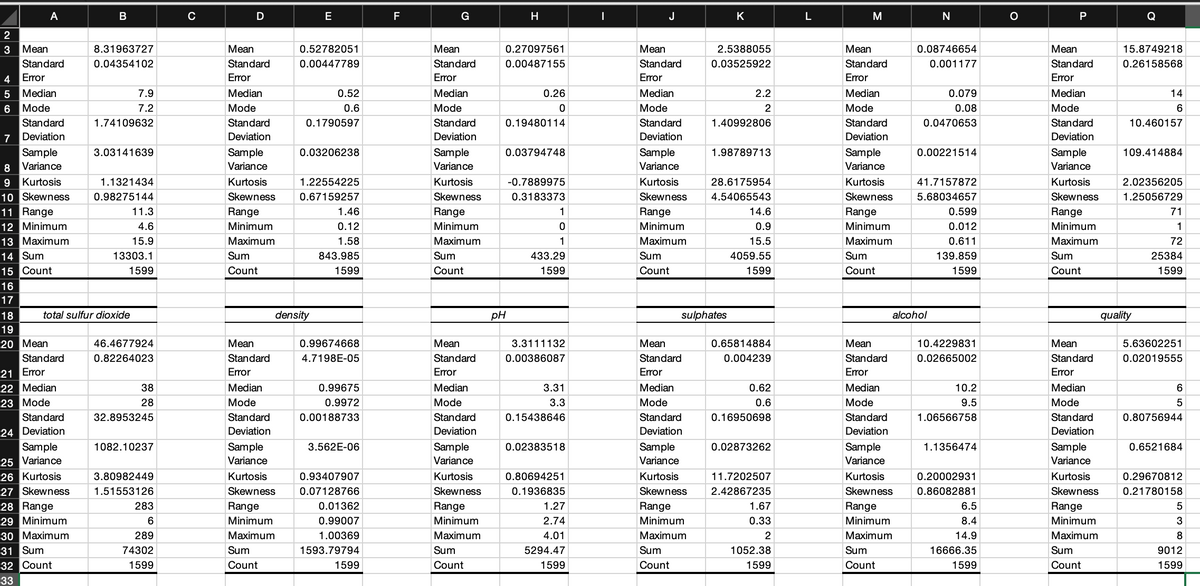
Transcribed Image Text:23
A
Mean
Standard
4 Error
5 Median
6 Mode
Standard
7 Deviation
Sample
8 Variance
9 Kurtosis
10 Skewness
11 Range
12 Minimum
13 Maximum
14 Sum
15 Count
16
17
18
19
20 Mean
Standard
21 Error
22 Median
23 Mode
Standard
24 Deviation
Sample
25 Variance
26 Kurtosis
27 Skewness
28 Range
29 Minimum
B
30 Maximum
31 Sum
32 Count
33
8.31963727
0.04354102
total sulfur dioxide
7.9
7.2
1.74109632
3.03141639
1.1321434
0.98275144
11.3
4.6
15.9
13303.1
1599
46.4677924
0.82264023
38
28
32.8953245
1082.10237
3.80982449
1.51553126
283
6
289
74302
1599
C
D
Mean
Standard
Error
Median
Mode
Standard
Deviation
Sample
Variance
Kurtosis
Skewness
Range
Minimum
Maximum
Sum
Count
Mean
Standard
Error
Median
Mode
Standard
Deviation
Sample
Variance
Kurtosis
Skewness
Range
Minimum
Maximum
Sum
Count
E
0.52782051
0.00447789
0.52
0.6
0.1790597
density
0.03206238
1.22554225
0.67159257
1.46
0.12
1.58
843.985
1599
0.99674668
4.7198E-05
0.99675
0.9972
0.00188733
3.562E-06
0.93407907
0.07128766
0.01362
0.99007
1.00369
1593.79794
1599
F
G
Mean
Standard
Error
Median
Mode
Standard
Deviation
Sample
Variance
Kurtosis
Skewness
Range
Minimum
Maximum
Sum
Count
Mean
Standard
Error
Median
Mode
Standard
Deviation
Sample
Variance
Kurtosis
Skewness
Range
Minimum
Maximum
Sum
Count
H
0.27097561
0.00487155
0.26
0
0.19480114
pH
0.03794748
-0.7889975
0.3183373
1
0
1
433.29
1599
3.3111132
0.00386087
3.31
3.3
0.15438646
0.02383518
0.80694251
0.1936835
1.27
2.74
4.01
5294.47
1599
I
J
Mean
Standard
Error
Median
Mode
Standard
Deviation
Sample
Variance
Kurtosis
Skewness
Range
Minimum
Maximum
Sum
Count
Mean
Standard
Error
Median
Mode
Standard
Deviation
Sample
Variance
Kurtosis
Skewness
Range
Minimum
Maximum
Sum
Count
K
2.5388055
0.03525922
2.2
2
1.40992806
sulphates
1.98789713
28.6175954
4.54065543
14.6
0.9
15.5
4059.55
1599
0.65814884
0.004239
0.62
0.6
0.16950698
0.02873262
11.7202507
2.42867235
1.67
0.33
2
1052.38
1599
L
M
Mean
Standard
Error
Median
Mode
Standard
Deviation
Sample
Variance
Kurtosis
Skewness
Range
Minimum
Maximum
Sum
Count
Mean
Standard
Error
Median
Mode
Standard
Deviation
Sample
Variance
Kurtosis
Skewness
Range
Minimum
Maximum
Sum
Count
N
0.08746654
0.001177
0.079
0.08
0.0470653
0.00221514
alcohol
41.7157872
5.68034657
0.599
0.012
0.611
139.859
1599
10.4229831
0.02665002
10.2
9.5
1.06566758
1.1356474
0.20002931
0.86082881
6.5
8.4
14.9
16666.35
1599
O
P
Mean
Standard
Error
Median
Mode
Standard
Deviation
Sample
Variance
Kurtosis
Skewness
Range
Minimum
Maximum
Sum
Count
Mean
Standard
Error
Median
Mode
Standard
Deviation
Sample
Variance
Kurtosis
Skewness
Range
Minimum
Maximum
Sum
Count
Q
15.8749218
0.26158568
14
6
10.460157
109.414884
quality
2.02356205
1.25056729
71
1
72
25384
1599
5.63602251
0.02019555
6
5
0.80756944
0.6521684
0.29670812
0.21780158
5
3
8
9012
1599
Expert Solution
This question has been solved!
Explore an expertly crafted, step-by-step solution for a thorough understanding of key concepts.

This is a popular solution!

Trending now
This is a popular solution!

Step by step
Solved in 4 steps

Recommended textbooks for you
MATLAB: An Introduction with Applications
Statistics
ISBN:
9781119256830
Author:
Amos Gilat
Publisher:
John Wiley & Sons Inc

Probability and Statistics for Engineering and th…
Statistics
ISBN:
9781305251809
Author:
Jay L. Devore
Publisher:
Cengage Learning

Statistics for The Behavioral Sciences (MindTap C…
Statistics
ISBN:
9781305504912
Author:
Frederick J Gravetter, Larry B. Wallnau
Publisher:
Cengage Learning
MATLAB: An Introduction with Applications
Statistics
ISBN:
9781119256830
Author:
Amos Gilat
Publisher:
John Wiley & Sons Inc
Probability and Statistics for Engineering and th…
Statistics
ISBN:
9781305251809
Author:
Jay L. Devore
Publisher:
Cengage Learning
Statistics for The Behavioral Sciences (MindTap C…
Statistics
ISBN:
9781305504912
Author:
Frederick J Gravetter, Larry B. Wallnau
Publisher:
Cengage Learning

Elementary Statistics: Picturing the World (7th E…
Statistics
ISBN:
9780134683416
Author:
Ron Larson, Betsy Farber
Publisher:
PEARSON

The Basic Practice of Statistics
Statistics
ISBN:
9781319042578
Author:
David S. Moore, William I. Notz, Michael A. Fligner
Publisher:
W. H. Freeman

Introduction to the Practice of Statistics
Statistics
ISBN:
9781319013387
Author:
David S. Moore, George P. McCabe, Bruce A. Craig
Publisher:
W. H. Freeman