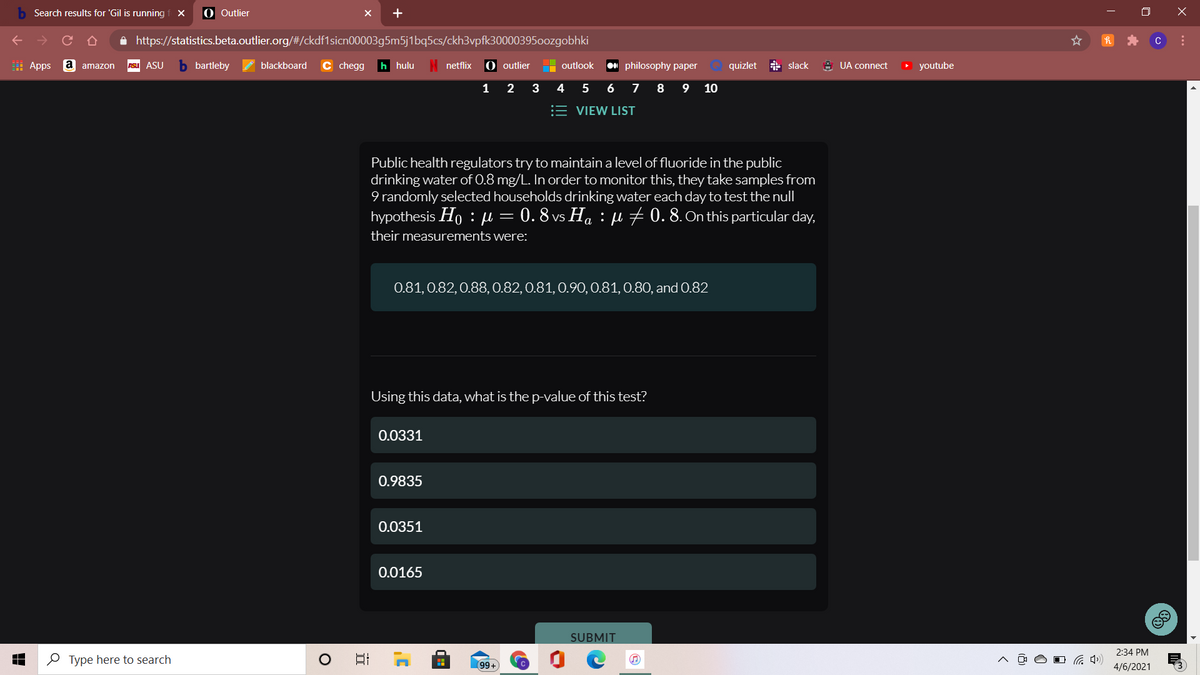
Public health regulators try to maintain a level of fluoride in the public drinking water of 0.8 mg/L. In order to monitor this, they take samples from 9 randomly selected households drinking water each day to test the null hypothesis Ho : µ = 0. 8 vs Ha : µ # 0. 8. On this particular day, their measurements were: 0.81, 0.82,0.88, 0.82,0.81,0.90,0.81,0.80, and 0.82 Using this data, what is the p-value of this test? 0.0331 0.9835 0.0351 0.0165
Q: I want to assess whether different types of movies increase viewers’ stress response. I recruit 24…
A: f. Between degrees of freedom is 2. Error degrees of freedom is 21 Level of significance is 0.05.…
Q: Life-saving drug: Penicillin is produced by the Penicillium fungus, which is grown in a broth whose…
A: (A) Construct the ANOVA table. Use EXCEL Procedure to obtain the ANOVA table. Follow the instruction…
Q: (d) Suppose it had previously been believed that when air void increased by 1 percent, the…
A:
Q: The Board of Transportation and Safety (BTS) wants to examine the safety mechanisms of A, B, and…
A:
Q: A researcher hypothesized that university students gain weight during their first year of study, and…
A: A sample of 100 students from each of the 300 universities selected to test the first year study is…
Q: at 5% significance level Họ HZ HO; Ho iH < HO If the test statistic calculated to test the…
A: NOTE: As per the guidelines, we are supposed to solve one question only. Kindly repost other as…
Q: This produces findings that are too high and too low in approximately equal amounts. O Both are…
A: Random Error: Random Error may be defined as the difference between the True value and estimated…
Q: As a result of complaints from customers about delivery times, the manager at a pizza delivery…
A: Null hypothesis H0:mu equals 20 Alternate hypothesis H1:mu not equals 20
Q: a) Based on the samples, do we have some evidence to suggest that on average, the body structure of…
A: a) For group dated from 4000 BC has a mean 131.367 and group dated from 200 BC has a mean 135.633 ,…
Q: Stock A has a beta of 1.2 and Stock B has a beta of 1. The returns of Stock A are ______ sensitive…
A: The relative Beta sensitivity of one stock can be measured in terms of other as follows.…
Q: QUESTION 10 Researchers claim that 40 is the average number of tissues a person uses during the…
A: Hypothesis testing can be conducted to draw conclusions about population parameters using the sample…
Q: An article in Journal of Food Science (2001, Vol. 66, No. 3, pp. 472-477) studied potato spoilage…
A:
Q: About half of the police officers in Baltimore, Maryland, have completed a special course in…
A: One proportion Z test is applicable
Q: Conduct a test (at an alpha of .05) to answer whether or not San Angelonian’s salary is…
A:
Q: 2. Find the test statistic (2 decimal places) 3. Give the P-value (4 decimal places) please…
A: 2. The sample proportion for non-seatbelt wearing passengers is, p^N=xNnN=34335=0.1015 The sample…
Q: Consider the following two formulations of the bivariate PRF, where ui and εi are both mean-0…
A: Given information: The two regression models are given.
Q: 4. If we set alpha at .01 and we obtain ap value of .04, can we reject the null hypothesis? Why?
A: As per guideline expert have to answer first question only dear student please upload other question…
Q: music
A: By applying ANOVA test for a single factor,
Q: A health researcher is interested in comparing 3 methods of weight loss: low calorie diet, low fat…
A: First enter this data into Excel The hypothesis can be formed as
Q: Consider the following two formulations of the bivariate PRF, where ui and εi are both mean-0…
A:
Q: Using the information provided in the SPSS output. You are asked to make a decision about whether to…
A: Answer A. Since the p-value is larger than alpha, you do not reject the null hypothesis
Q: An article in the ASCE Journal of Energy Engineering (1999, Vol. 125, pp. 59-75) describes a study…
A: Given information- Population mean, μ = 22.5 Sample size, n = 5 I have used following functions for…
Q: temperatures (°C) reported were as follows: 23.01, 22.22, 22.04, 22.62, and 22.59. Test that the…
A: Given that Five samples of the material were tested in a structure, and the average interior…
Q: Historically, the proportion of people who trade in their old car to a car dealer when purchasing a…
A:
Q: Consider the following model: Y1 = a +y+E1 Y2 = a+ 8+ €2 Y3 = 6-Y+€3 Y4 = a - y+28 + €4 where a, y…
A: We have given the models Where alpha beta and delta are unknown constant and ei follows…
Q: concentration differs among the three days? Use the =α0.05 level of significance and the ANOVA…
A:
Q: Question 1 A car company claims that their Super Spiffy Sedan averages 31 mpg. You randomly select 8…
A:
Q: . Based on the rule of thumb, we use n-1 from the smaller sample for our degrees of freedom. What is…
A: The test statistic is given by t = 0.37 Smaller sample size n = 28 Level of significance = 0.05
Q: Radiation in Baby Teeth Listed below are amounts of strontium-90 (in millibecquerels, or mBq) in a…
A: In this case we need to construct the boxplot for the amounts of strontium-90 and also identify the…
Q: f. What is our critical F value (from table)? g. Fill in the ANOVA summary table with your data Sum…
A:
Q: A band limited white noise has a single sided PSD of 100 over the frequency range of 1 to 26 hz.…
A: Given: Variance of PSD is 100
Q: Dr. Stevenson reported the following in a journal: “F (4, 106) = 10.09, p = .04.” Should Dr.…
A:
Q: 1. An investigator wants to test if there is a difference in endotoxin levels in children who are…
A:
Q: 1.Distinguish p-value from alpha. 2. Which of the following alpha values provides the strongest…
A: 1) If p-value is less than alpha(i.e 0.05) we reject the null Hypothesis and If p-value is greater…
Q: Each person in a random sample of 400 residents in a major town was asked whether they had ever been…
A:
Q: Participant Rock Classical Heavy Metal ROW MEANS = 1 70 64 90 74.67 2 78 69 85 77.33…
A:
Q: f your p-value is 0.002, what is the most significant alpha level? There is no 'most significant…
A: If p-value is less than alpha, then it is significant.
Q: A researcher is interested in examining whether doctors are as accurate at diagnosing certain…
A: Claim: A researcher is interested in examining whether doctors are as accurate at diagnosing certain…
Q: Penicillin is produced by the Penicillium fungus, which is grown in a broth whose sugar content must…
A:
Q: The article refered to in Exercise 1 also considered the effect of gypsum on the electric…
A:
Q: QUESTION SIX a. Over a long period of time, at the New York University canteen, it has been found…
A: a. Let 'p' be the proportion of people eating vegetarian meals. p1= proportion of people eating…
Q: An article reports the following values for soil heat flux of eight plots covered with coal dust.…
A: Given that the mean soil heat flux for plots covered only with grass is 29 Claim : The coal dust is…
Q: The time X of a radioactive isotope decays with an expected value of 10 years, and is modeled as an…
A: Let X be the time of a radioactive isotope decays We know that, the pdf of exponential distribution…
Q: In single-sample, upper-tail test hypothesis test, if the researcher changes the alpha level from…
A: Given: On considering the single sample on using the upper tail test hypothesis the researcher…
Q: You obtain a t comp of .975 in a two sample independent t test with alpha at .05. Is it…
A: Two sample t test is used to test the significance difference between two group mean. P value : The…
Q: Compute E(3/10) for the following model, where e~wn (0,0.16), i.e., a white noise process with mean…
A:
Q: Penicillin is produced by the Penicillium fungus, which is grown in a broth whose sugar content must…
A: Since you have posted a question with multiple sub-parts, we will solve first three subparts for…
Q: The Board of Transportation and Safety (BTS) wants to examine the safety mechanisms of A, B, and…
A: Test Hypotheses: There are 3 types of cars. Denote the true average of the three types of cars A, B…
Q: Life-saving drug: Penicillin is produced by the Penicillin fungus, which is grown in a broth whose…
A: Null hypothesis: H0:µ1 = µ2 = µ3 Alternative hypothesis: H1: At least one of the means is different…
Q: How many hours of sleep do people get by listening to music? I record 10 subjects’ hours of sleep…
A:
Trending now
This is a popular solution!
Step by step
Solved in 2 steps with 3 images
- A researcher conducted a study to investigate whether local car dealers tend to charge women more than men for the same car model. Using information from the county tax collector’s records, the researcher randomly selected one man and one woman from among everyone who had purchased the same model of an identically equipped car from the same dealer. The process was repeated for a total of 8 randomly selected car models. The purchase prices and the differences (woman – man) are shown in the table below. Summary statistics are also shown. Dotplots of the data and the differences are shown below. Do the data provide convincing evidence that, on average, women pay more than men in the county for the same car model?Cynthia, Mary, Mika, and Sallieof Hu’s Ur Dedi Cerveza Corp. conducted a survey on their 12-ounce cans to be sure that the variance of the amount of beer, in each can, was no more than 0.02square ounces. They collected a random sample of twenty cans of their 12-ounce beer, pulled from their production line, and got a sample variance of 0.015square ounces. Assume that the amount of beer in all 12-ounce cans to be normally distributed. Help them: a.Construct a 95% confidence interval for the population variance. b.Construct a 99% confidence interval for the standard deviation.A nationwide job recruiting firm wants to compare the annual incomes for childcare workers in New York and Illinois. Due to recent trends in the childcare industry, the firm suspects that the that the mean annual income of childcare workers in the state of New York is greater than the mean annual income of childcare workers in Illinois. To see if this is true, the firm selected a random sample of 20 childcare workers from New York and an independent random sample of 20 childcare workers from Illinois and asked them to report their mean annual income. The data obtained were as follows. Annual income in dollars New York 46686 , 34979 , 47325 , 48892 , 51128 , 56792 , 47785 , 48995 , 57301 , 55176 , 48002 , 45718 , 50351 , 58527 , 47067 , 53699 , 54361 , 49727 , 36426 , 50870 Illinois 48009 , 46871 , 42774 , 49790 , 43163 , 45401 , 41068 , 50300 , 47064 , 42003 , 47775 , 41917…
- When 2 births are randomly selected, the sample space for genders is bb, bg, gb and gg. Assume that those 4 outcomes are equally likely. Construct a table that describes the sampling distribution of the sample proportion of girls from 2 births. Dies the mean of the sample proportions equal the proportion of girls in 2 births? Does the result suggest that a sample proportion is an unbiased estimator of a population proportion? For the entire population, assume the probability of having a boy is 1/2, the probability of having s girl is 1/2 and this is not affected by how many boys or girls have previously been born. Determine the probabilities of each sample proportion, (type integers or simplified fractions)A business magazine mailed a questionnaire to the treasurers of all of the Top 400 most profitable companies, and received responses from 25% of them. Those responding reported that they did not find that such surveys intruded significantly on their workday. Identify any potential sources of bias you can detect and any problems you see in generalizing the population. Undercoverage is possible, since only treasurers of the top 400 profitable companies were surveyed instead of all treasurers. Nonresponse bias is possible, since treasurers who feel that surveys intrude on their workday would be less likely to respond. Convenience sampling bias is possible, since it is easier to get information from the treasurers at the top 400 profitable companies than at other companies. There is no indication of bias.Samples that are not chosen randomly from the population might exhibit bias True False
- Following an oil spill, a particular region of the ocean is being tested for the level of a chemical called naphthalene. It is considered fact that fish from the region will be safe to eat if, and only if, the mean naphthalene level in the region is less than 3.3 parts per billion. A set of water specimens will be randomly selected from the region and tested, and if the results provide convinving evidence that the mean naphthalene level is less than 3.3, then the sale of fish from the region will be made legal. Which of the following describes a Type I error and its consequences? A) the authorities fail to obtain convincing evidence that the mean naphthalene level is less than 3.3, and do not legalize the sale of fish from the region when in fact the fish are SAFE for consumption. B) The definition of a Type I error depends on the actual results of the study in question C) The authorities fail to obtain convincing evidence that the mean naphthalene level is less than 3.3, and do not…A lot of goods consisting of 2000 portable batteries will be controlled by the importing company. According to the acceptance sampling plan used, 2% of the lot is randomly selected, if at most 2.5% of the batteries in this sample are found to be defective, the party is accepted, otherwise it is rejected. a)Calculate the acceptance probabilities of the lot for the cases where the defective percentage is 0.5%, 1%, 2%, 3% and 8%.b)Plot the OC curve.c)If the producer risk is 1%, find and interpret the acceptable level of quality.d)If the consumer risk is 10%, find the level of refusable quality and interpret it.e)Show the acceptable quality level and the rejected quality level on the OC curve.A statistician selects a sample of 20 participants and makes the decision to retain the null hypothesis. He conducts the same study testing the same hypothesis with a sample of 100 participants and makes the decision to reject the null hypothesis. Provide a likely explanation for why the two samples led to different decisions.
- A warehouse manager wants to know if there is an association between the shift worked and being on time for work. To investigate, he selects a random sample of 70 workers and classifies each one according to the shift they worked most recently and whether they were on time for work. He was unable to classify a substantial number of people as being on time, so he classified those individuals as unknown. The data are displayed in the table. The manager would like to know if these data provide convincing evidence of an association between the shift worked and being on time in the large population of all workers at this warehouse. The random and 10% conditions are met. Is the Large Counts condition met? Yes, the smallest expected count is 5, so all expected counts are at least 5. Yes, the smallest expected count is 8.54, so all expected counts are at least 5. No, the smallest expected count is 2.56, so the expected counts are not all at least 5. No, the smallest expected count is…If a statistic used to estimate a parameter is such that the mean of its sampling distribution is equal to the true value of the parameter being estimated, then that statistic: 1. is a proportion. 2. is biased. 3. is unbiased. 4. has low variation. is random.When two births are randomly selected, the sample space for genders is BB, BG, GB, and GG. Assume that those four outcomes are equally likely. Construct a table that describes the sampling distribution of the sample proportion of girls from two births. Does the mean of the sample proportions equal proportion of girls in two births? Does the results suggest that a sample proportion is an unbiased estimator of a population proportion? For the entire population, assume the probability of having a boy is 1/2, the probability of having a girl as 1/2 and this is not affected by how many boys or girls have previously been born