Q No.1 Use the following selected financial data for Happy Valley Co. to answer questions. Net sales Rs.200,000 Cost of goods sold Operating expenses Net income 90,000 80,000 Total assets Total liabilities 10,000 180,000 120,000 Calculate (1) debt ratio (2) operating profit margin (3) return on equity (4) net profit margin (5) Gross Profit ratio (6) Operating expense ratio (7) Assets turnover
Q No.1 Use the following selected financial data for Happy Valley Co. to answer questions. Net sales Rs.200,000 Cost of goods sold Operating expenses Net income 90,000 80,000 Total assets Total liabilities 10,000 180,000 120,000 Calculate (1) debt ratio (2) operating profit margin (3) return on equity (4) net profit margin (5) Gross Profit ratio (6) Operating expense ratio (7) Assets turnover

Managerial Accounting
15th Edition
ISBN:9781337912020
Author:Carl Warren, Ph.d. Cma William B. Tayler
Publisher:Carl Warren, Ph.d. Cma William B. Tayler
Chapter16: Financial Statement Analysis
Section: Chapter Questions
Problem 4PB

Related questions
Question
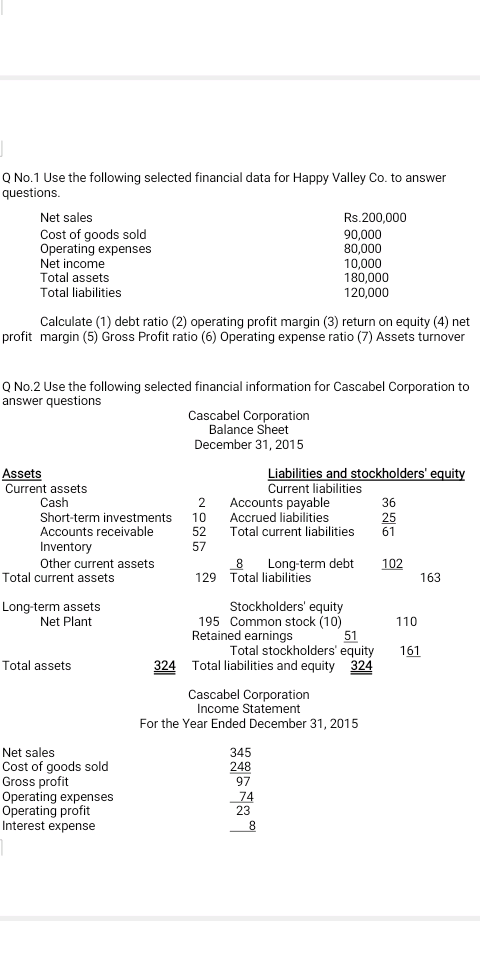
Transcribed Image Text:Q No.1 Use the following selected financial data for Happy Valley Co. to answer
questions.
Net sales
Rs.200,000
Cost of goods sold
Operating expenses
90,000
80,000
10,000
180,000
120,000
Net income
Total assets
Total liabilities
Calculate (1) debt ratio (2) operating profit margin (3) return on equity (4) net
profit margin (5) Gross Profit ratio (6) Operating expense ratio (7) Assets turnover
Q No.2 Use the following selected financial information for Cascabel Corporation to
answer questions
Cascabel Corporation
Balance Sheet
December 31, 2015
Liabilities and stockholders' equity
Current liabilities
Accounts payable
Accrued liabilities
Assets
Current assets
Cash
Short-term investments
Accounts receivable
36
10
25
61
52
Total current liabilities
Inventory
Other current assets
57
Long-term debt
102
Total current assets
129 Total liabilities
163
Stockholders' equity
195 Common stock (10)
51
Total stockholders' equity
324 Total liabilities and equity 324
Long-term assets
Net Plant
110
Retained earnings
161
Total assets
Cascabel Corporation
Income Statement
For the Year Ended December 31, 2015
Net sales
Cost of goods sold
Gross profit
Operating expenses
Operating profit
Interest expense
345
248
97
74
23
8.
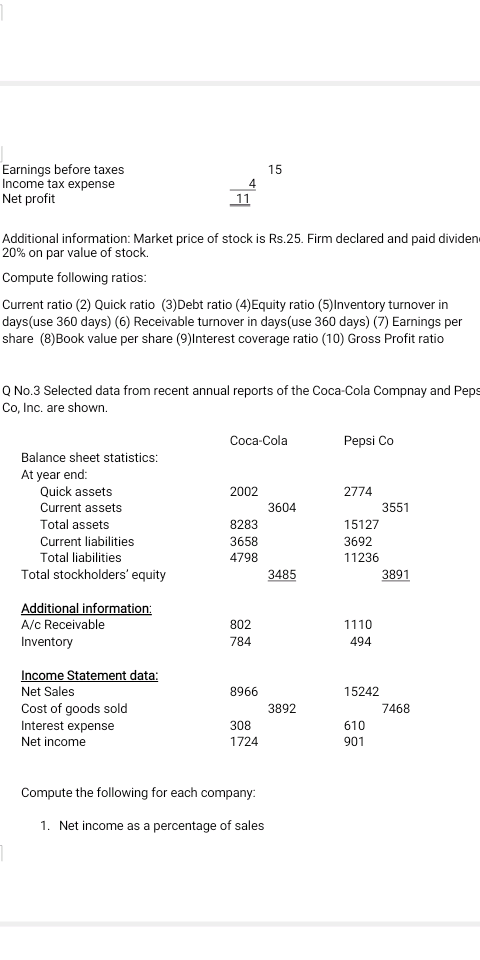
Transcribed Image Text:Earnings before taxes
Income tax expense
Net profit
15
11
Additional information: Market price of stock is Rs.25. Firm declared and paid dividen
20% on par value of stock.
Compute following ratios:
Current ratio (2) Quick ratio (3)Debt ratio (4)Equity ratio (5)Inventory turnover in
days(use 360 days) (6) Receivable turnover in days(use 360 days) (7) Earnings per
share (8)Book value per share (9)Interest coverage ratio (10) Gross Profit ratio
Q No.3 Selected data from recent annual reports of the Coca-Cola Compnay and Peps
Co, Inc. are shown.
Coca-Cola
Pepsi Co
Balance sheet statistics:
At year end:
Quick assets
2002
2774
Current assets
3604
3551
Total assets
8283
15127
Current liabilities
Total liabilities
3658
3692
4798
11236
Total stockholders' equity
3485
3891
Additional information:
A/c Receivable
802
1110
Inventory
784
494
Income Statement data:
Net Sales
8966
15242
Cost of goods sold
Interest expense
Net income
3892
7468
308
610
1724
901
Compute the following for each company:
1. Net income as a percentage of sales
Expert Solution
This question has been solved!
Explore an expertly crafted, step-by-step solution for a thorough understanding of key concepts.

This is a popular solution!

Trending now
This is a popular solution!

Step by step
Solved in 2 steps with 2 images

Knowledge Booster


Learn more about
Need a deep-dive on the concept behind this application? Look no further. Learn more about this topic, accounting and related others by exploring similar questions and additional content below.Recommended textbooks for you
Managerial Accounting
Accounting
ISBN:
9781337912020
Author:
Carl Warren, Ph.d. Cma William B. Tayler
Publisher:
South-Western College Pub

Financial And Managerial Accounting
Accounting
ISBN:
9781337902663
Author:
WARREN, Carl S.
Publisher:
Cengage Learning,

Survey of Accounting (Accounting I)
Accounting
ISBN:
9781305961883
Author:
Carl Warren
Publisher:
Cengage Learning
Managerial Accounting
Accounting
ISBN:
9781337912020
Author:
Carl Warren, Ph.d. Cma William B. Tayler
Publisher:
South-Western College Pub
Financial And Managerial Accounting
Accounting
ISBN:
9781337902663
Author:
WARREN, Carl S.
Publisher:
Cengage Learning,
Survey of Accounting (Accounting I)
Accounting
ISBN:
9781305961883
Author:
Carl Warren
Publisher:
Cengage Learning

Managerial Accounting: The Cornerstone of Busines…
Accounting
ISBN:
9781337115773
Author:
Maryanne M. Mowen, Don R. Hansen, Dan L. Heitger
Publisher:
Cengage Learning

Fundamentals of Financial Management, Concise Edi…
Finance
ISBN:
9781305635937
Author:
Eugene F. Brigham, Joel F. Houston
Publisher:
Cengage Learning

Pfin (with Mindtap, 1 Term Printed Access Card) (…
Finance
ISBN:
9780357033609
Author:
Randall Billingsley, Lawrence J. Gitman, Michael D. Joehnk
Publisher:
Cengage Learning