Q. 5 The following data present deaths by cause and mid-year population: 1960 Costa Rican males. Mid-Year Deaths Age Interval Population Total Diarrhea Cancer CVD* 0ther Causes
Q. 5 The following data present deaths by cause and mid-year population: 1960 Costa Rican males. Mid-Year Deaths Age Interval Population Total Diarrhea Cancer CVD* 0ther Causes

Functions and Change: A Modeling Approach to College Algebra (MindTap Course List)
6th Edition
ISBN:9781337111348
Author:Bruce Crauder, Benny Evans, Alan Noell
Publisher:Bruce Crauder, Benny Evans, Alan Noell
Chapter5: A Survey Of Other Common Functions
Section5.3: Modeling Data With Power Functions
Problem 6E: Urban Travel Times Population of cities and driving times are related, as shown in the accompanying...

Related questions

Question
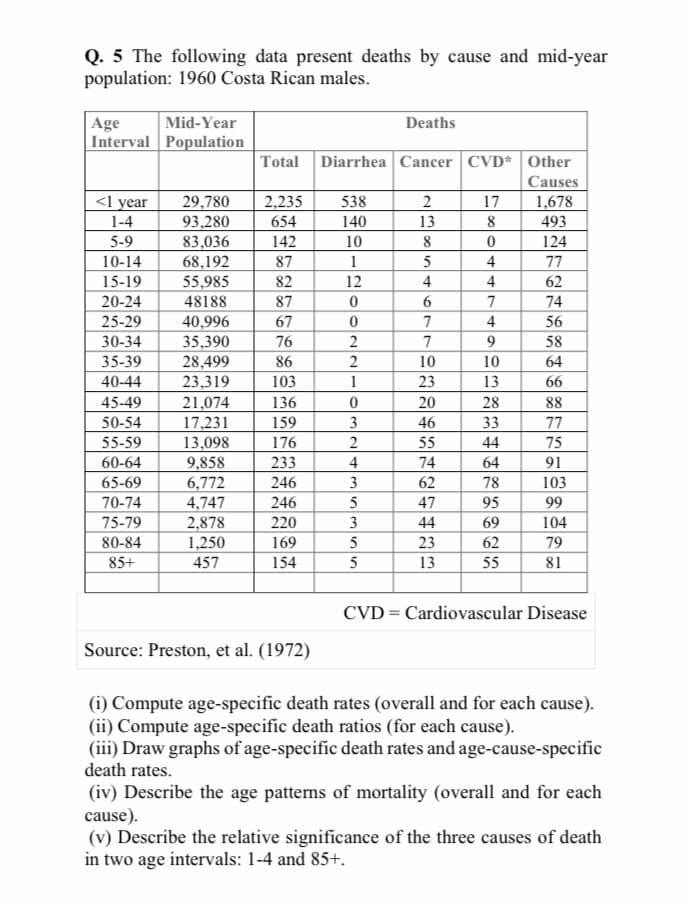
Transcribed Image Text:Q. 5 The following data present deaths by cause and mid-year
population: 1960 Costa Rican males.
Age
Interval Population
Mid-Year
Deaths
Total Diarrhea Cancer CVD* Other
Causes
<l year
1-4
5-9
29,780
93,280
83,036
68,192
55,985
2,235
538
17
1,678
493
654
140
13
8
142
10
8
124
10-14
87
1
5
4
77
15-19
82
12
4
4
62
20-24
48188
87
7
74
25-29
40,996
67
7
4
56
30-34
35,390
28,499
23,319
21,074
17,231
13,098
9,858
6,772
4,747
2,878
1,250
457
76
7
9.
58
35-39
86
10
10
64
40-44
103
1
23
13
66
45-49
136
20
28
88
50-54
159
3
46
33
77
55-59
176
2
55
44
75
60-64
233
4
74
64
91
246
246
65-69
3
62
78
103
70-74
5
95
99
47
44
23
75-79
220
3
69
104
80-84
169
5
62
79
85+
154
5
13
55
81
CVD = Cardiovascular Disease
Source: Preston, et al. (1972)
(i) Compute age-specific death rates (overall and for each cause).
(ii) Compute age-specific death ratios (for each cause).
(iii) Draw graphs of age-specific death rates and age-cause-specific
death rates.
(iv) Describe the age patterns of mortality (overall and for each
cause).
(v) Describe the relative significance of the three causes of death
in two age intervals: 1-4 and 85+.
Expert Solution
This question has been solved!
Explore an expertly crafted, step-by-step solution for a thorough understanding of key concepts.

Step by step
Solved in 3 steps

Knowledge Booster


Learn more about
Need a deep-dive on the concept behind this application? Look no further. Learn more about this topic, statistics and related others by exploring similar questions and additional content below.Recommended textbooks for you
Functions and Change: A Modeling Approach to Coll…
Algebra
ISBN:
9781337111348
Author:
Bruce Crauder, Benny Evans, Alan Noell
Publisher:
Cengage Learning
Functions and Change: A Modeling Approach to Coll…
Algebra
ISBN:
9781337111348
Author:
Bruce Crauder, Benny Evans, Alan Noell
Publisher:
Cengage Learning