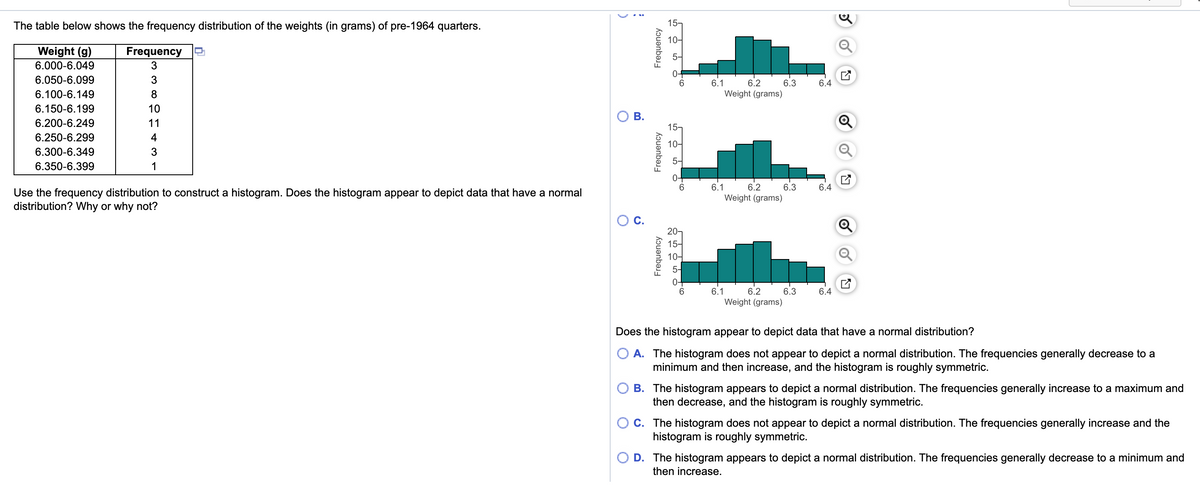
The table below shows the frequency distribution of the weights (in grams) of pre-1964 quarters. 15- 10- Weight (g) 6.000-6.049 Frequency P 5- 3 0- 6.050-6.099 3 6.1 6.2 6.3 Weight (grams) 6.4 6.100-6.149 8 6.150-6.199 10 OB. 6.200-6.249 11 Q 15- 6.250-6.299 4 10어 6.300-6.349 3 6.350-6.399 1 6.1 6.4 Use the frequency distribution to construct a histogram. Does the histogram appear to depict data that have a normal distribution? Why or why not? 6.2 6.3 Weight (grams) OC. Q 20- 15- 10- 5- 6.3 Weight (grams) 6.1 6.2 6.4 Does the histogram appear to depict data that have a normal distribution? O A. The histogram does not appear to depict a normal distribution. The frequencies generally decrease to a minimum and then increase, and the histogram is roughly symmetric. O B. The histogram appears to depict a normal distribution. The frequencies generally increase to a maximum and then decrease, and the histogram is roughly symmetric. OC. The histogram does not appear to depict a normal distribution. The frequencies generally increase and the histogram is roughly symmetric. O D. The histogram appears to depict a normal distribution. The frequencies generally decrease to a minimum and then increase. kouanbasg
The table below shows the frequency distribution of the weights (in grams) of pre-1964 quarters. 15- 10- Weight (g) 6.000-6.049 Frequency P 5- 3 0- 6.050-6.099 3 6.1 6.2 6.3 Weight (grams) 6.4 6.100-6.149 8 6.150-6.199 10 OB. 6.200-6.249 11 Q 15- 6.250-6.299 4 10어 6.300-6.349 3 6.350-6.399 1 6.1 6.4 Use the frequency distribution to construct a histogram. Does the histogram appear to depict data that have a normal distribution? Why or why not? 6.2 6.3 Weight (grams) OC. Q 20- 15- 10- 5- 6.3 Weight (grams) 6.1 6.2 6.4 Does the histogram appear to depict data that have a normal distribution? O A. The histogram does not appear to depict a normal distribution. The frequencies generally decrease to a minimum and then increase, and the histogram is roughly symmetric. O B. The histogram appears to depict a normal distribution. The frequencies generally increase to a maximum and then decrease, and the histogram is roughly symmetric. OC. The histogram does not appear to depict a normal distribution. The frequencies generally increase and the histogram is roughly symmetric. O D. The histogram appears to depict a normal distribution. The frequencies generally decrease to a minimum and then increase. kouanbasg

Glencoe Algebra 1, Student Edition, 9780079039897, 0079039898, 2018
18th Edition
ISBN:9780079039897
Author:Carter
Publisher:Carter
Chapter10: Statistics
Section: Chapter Questions
Problem 26SGR

Related questions

Topic Video
Question
Transcribed Image Text:15-
The table below shows the frequency distribution of the weights (in grams) of pre-1964 quarters.
10-
Weight (g)
Frequency
6.000-6.049
6.050-6.099
6.
6.1
6.2
6.3
6.4
6.100-6.149
8.
Weight (grams)
6.150-6.199
10
6.200-6.249
11
15-
6.250-6.299
4
10-
6.300-6.349
6.350-6.399
1
6.
6.1
6.2
6.3
6.4
Use the frequency distribution to construct a histogram. Does the histogram appear to depict data that have a normal
distribution? Why or why not?
Weight (grams)
Oc.
20-
15-
10-
5-
6.1
6.2
6.3
6.4
Weight (grams)
Does the histogram appear to depict data that have a normal distribution?
O A. The histogram does not appear to depict a normal distribution. The frequencies generally decrease to a
minimum and then increase, and the histogram is roughly symmetric.
B. The histogram appears to depict a normal distribution. The frequencies generally increase to a maximum and
then decrease, and the histogram is roughly symmetric.
C. The histogram does not appear to depict a normal distribution. The frequencies generally increase and the
histogram is roughly symmetric.
D. The histogram appears to depict a normal distribution. The frequencies generally decrease to a minimum and
then increase.
B.
Frequency
Frequency
Frequency
Expert Solution
This question has been solved!
Explore an expertly crafted, step-by-step solution for a thorough understanding of key concepts.

This is a popular solution!

Trending now
This is a popular solution!

Step by step
Solved in 2 steps with 1 images

Knowledge Booster


Learn more about
Need a deep-dive on the concept behind this application? Look no further. Learn more about this topic, statistics and related others by exploring similar questions and additional content below.Recommended textbooks for you
Glencoe Algebra 1, Student Edition, 9780079039897…
Algebra
ISBN:
9780079039897
Author:
Carter
Publisher:
McGraw Hill
Glencoe Algebra 1, Student Edition, 9780079039897…
Algebra
ISBN:
9780079039897
Author:
Carter
Publisher:
McGraw Hill