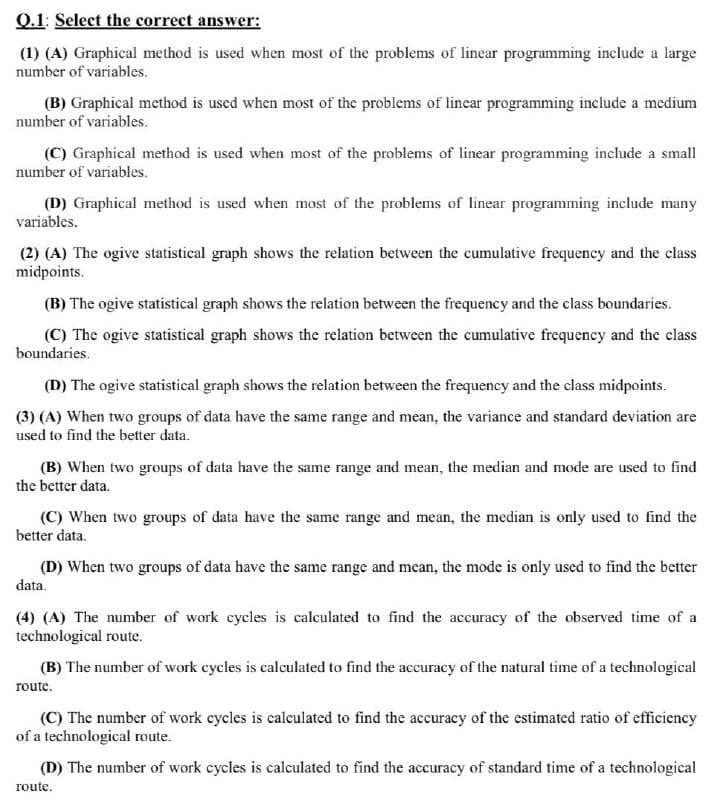
Q.1: Select the correct answer: (1) (A) Graphical method is used when most of the problems of linear programming include a large number of variables. (B) Graphical method is used when most of the problems of lincar programming include a medium number of variables. (C) Graphical method is used when most of the problems of linear programming include a small number of variables. (D) Graphical method is used when most of the problems of linear programming include many variables. (2) (A) The ogive statistical graph shows the relation between the cumulative frequency and the class midpoints. (B) The ogive statistical graph shows the relation between the frequency and the class boundaries. (C) The ogive statistical graph shows the relation between the cumulative frequeney and the class boundaries. (D) The ogive statistical graph shows the relation between the frequency and the class midpoints. (3) (A) When two groups of data have the same range and mean, the variance and standard deviation are used to find the better data. (B) When two groups of data have the same range and mean, the median and mode are used to find the better data. (C) When two groups of data have the same range and mean, the median is only used to find the better data. (D) When two groups of data have the same range and mean, the mode is only used to find the better data. (4) (A) The number of work cycles is calculated to find the accuracy of the observed time of a technological route. (B) The number of work cycles is calculated to find the accuracy of the natural time of a technological route. (C) The number of work cycles is calculated to find the accuracy of the estimated ratio of efficiency of a technological route. (D) The number of work cycles is calculated to find the accuracy of standard time of a technological route.
Q.1: Select the correct answer: (1) (A) Graphical method is used when most of the problems of linear programming include a large number of variables. (B) Graphical method is used when most of the problems of lincar programming include a medium number of variables. (C) Graphical method is used when most of the problems of linear programming include a small number of variables. (D) Graphical method is used when most of the problems of linear programming include many variables. (2) (A) The ogive statistical graph shows the relation between the cumulative frequency and the class midpoints. (B) The ogive statistical graph shows the relation between the frequency and the class boundaries. (C) The ogive statistical graph shows the relation between the cumulative frequeney and the class boundaries. (D) The ogive statistical graph shows the relation between the frequency and the class midpoints. (3) (A) When two groups of data have the same range and mean, the variance and standard deviation are used to find the better data. (B) When two groups of data have the same range and mean, the median and mode are used to find the better data. (C) When two groups of data have the same range and mean, the median is only used to find the better data. (D) When two groups of data have the same range and mean, the mode is only used to find the better data. (4) (A) The number of work cycles is calculated to find the accuracy of the observed time of a technological route. (B) The number of work cycles is calculated to find the accuracy of the natural time of a technological route. (C) The number of work cycles is calculated to find the accuracy of the estimated ratio of efficiency of a technological route. (D) The number of work cycles is calculated to find the accuracy of standard time of a technological route.

Elements Of Electromagnetics
7th Edition
ISBN:9780190698614
Author:Sadiku, Matthew N. O.
Publisher:Sadiku, Matthew N. O.
ChapterMA: Math Assessment
Section: Chapter Questions
Problem 1.1MA

Related questions

Question
None
Transcribed Image Text:Q.1: Select the correct answer:
(1) (A) Graphical method is used when most of the problems of linear programming include a large
number of variables.
(B) Graphical method is used when most of the problems of lincar programming include a medium
number of variables.
(C) Graphical method is used when most of the problems of linear programming include a small
number of variables.
(D) Graphical method is used when most of the problems of linear programming include many
variables.
(2) (A) The ogive statistical graph shows the relation between the cumulative frequency and the class
midpoints.
(B) The ogive statistical graph shows the relation between the frequency and the class boundaries.
(C) The ogive statistical graph shows the relation between the cumulative frequency and the class
boundaries.
(D) The ogive statistical graph shows the relation between the frequency and the class midpoints.
(3) (A) When two groups of data have the same range and mean, the variance and standard deviation are
used to find the better data.
(B) When two groups of data have the same range and mean, the median and mode are used to find
the better data.
(C) When two groups of data have the same range and mean, the median is only used to find the
better data.
(D) When two groups of data have the same range and mean, the mode is only used to find the better
data.
(4) (A) The number of work cycles is calculated to find the accuracy of the observed time of a
technological route.
(B) The number of work cycles is calculated to find the accuracy of the natural time of a technological
route.
(C) The number of work cycles is calculated to find the accuracy of the estimated ratio of efficiency
of a technological route.
(D) The number of work cycles is calculated to find the accuracy of standard time of a technological
route.
Expert Solution
This question has been solved!
Explore an expertly crafted, step-by-step solution for a thorough understanding of key concepts.

Step by step
Solved in 2 steps

Knowledge Booster


Learn more about
Need a deep-dive on the concept behind this application? Look no further. Learn more about this topic, mechanical-engineering and related others by exploring similar questions and additional content below.Recommended textbooks for you
Elements Of Electromagnetics
Mechanical Engineering
ISBN:
9780190698614
Author:
Sadiku, Matthew N. O.
Publisher:
Oxford University Press

Mechanics of Materials (10th Edition)
Mechanical Engineering
ISBN:
9780134319650
Author:
Russell C. Hibbeler
Publisher:
PEARSON

Thermodynamics: An Engineering Approach
Mechanical Engineering
ISBN:
9781259822674
Author:
Yunus A. Cengel Dr., Michael A. Boles
Publisher:
McGraw-Hill Education
Elements Of Electromagnetics
Mechanical Engineering
ISBN:
9780190698614
Author:
Sadiku, Matthew N. O.
Publisher:
Oxford University Press
Mechanics of Materials (10th Edition)
Mechanical Engineering
ISBN:
9780134319650
Author:
Russell C. Hibbeler
Publisher:
PEARSON
Thermodynamics: An Engineering Approach
Mechanical Engineering
ISBN:
9781259822674
Author:
Yunus A. Cengel Dr., Michael A. Boles
Publisher:
McGraw-Hill Education

Control Systems Engineering
Mechanical Engineering
ISBN:
9781118170519
Author:
Norman S. Nise
Publisher:
WILEY

Mechanics of Materials (MindTap Course List)
Mechanical Engineering
ISBN:
9781337093347
Author:
Barry J. Goodno, James M. Gere
Publisher:
Cengage Learning

Engineering Mechanics: Statics
Mechanical Engineering
ISBN:
9781118807330
Author:
James L. Meriam, L. G. Kraige, J. N. Bolton
Publisher:
WILEY