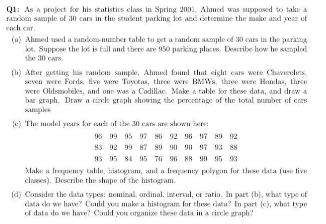
Q1: As a project foe his statistics elass in Spring 2001, Ahmsd was supposed to tako a TAikom sample of 30 cars in the student parking lot and dctemine the make and year of each car. (a) Ahmed ed a random-mber table to get a random aample of 30 cars ia the parking kt. Suppoe the kt is fill and there are 050 parking plices. Describe how he samplid the 30 cars. (1) After getting his randem sample, Almed found that cight cars were Chavenlers. sven were Fords, tive we Tuyctas, three were BMWa, three we Handas, three were Oldsmobies, and one was a Codillac. Make a table kor these data, and drew a ar graph. Draw a cick graph showing the percentage of the total mumber of cars saples fe) The model years kar saudt af the 30 cars are slwn bere: 95 99 95 97 86 92 96 97 89 92 83 92 99 87 S9 90 90 97 93 88 93 95 84 95 76 96 88 99 96 93 Make a freguney talla, histegram, and a fregenry polygon for thee data (ue live clses). Describe the shape of the histogram. (4) Consider the data types: nominal, andinal, laterval, et zatio. In part (b), what type of lata do we have? Conld sn make a histogram for thee data? In part (c), what type of data do we have? Cauld you onganize these data in a tirce graph
Q1: As a project foe his statistics elass in Spring 2001, Ahmsd was supposed to tako a TAikom sample of 30 cars in the student parking lot and dctemine the make and year of each car. (a) Ahmed ed a random-mber table to get a random aample of 30 cars ia the parking kt. Suppoe the kt is fill and there are 050 parking plices. Describe how he samplid the 30 cars. (1) After getting his randem sample, Almed found that cight cars were Chavenlers. sven were Fords, tive we Tuyctas, three were BMWa, three we Handas, three were Oldsmobies, and one was a Codillac. Make a table kor these data, and drew a ar graph. Draw a cick graph showing the percentage of the total mumber of cars saples fe) The model years kar saudt af the 30 cars are slwn bere: 95 99 95 97 86 92 96 97 89 92 83 92 99 87 S9 90 90 97 93 88 93 95 84 95 76 96 88 99 96 93 Make a freguney talla, histegram, and a fregenry polygon for thee data (ue live clses). Describe the shape of the histogram. (4) Consider the data types: nominal, andinal, laterval, et zatio. In part (b), what type of lata do we have? Conld sn make a histogram for thee data? In part (c), what type of data do we have? Cauld you onganize these data in a tirce graph

Algebra & Trigonometry with Analytic Geometry
13th Edition
ISBN:9781133382119
Author:Swokowski
Publisher:Swokowski
Chapter10: Sequences, Series, And Probability
Section10.8: Probability
Problem 38E

Related questions
Question
Transcribed Image Text:Q1: As a project foe his statistics elass in Spring 2001, Ahmsd was supposed to tako a
TAikom sample of 30 cars in the student parking lot and dctemine the make and year of
each car.
(a) Ahmed ed a random-mber table to get a random aample of 30 cars ia the parking
kt. Suppoe the kt is fill and there are 050 parking plices. Describe how he samplid
the 30 cars.
(1) After getting his randem sample, Almed found that cight cars were Chavenlers.
sven were Fords, tive we Tuyctas, three were BMWa, three we Handas, three
were Oldsmobies, and one was a Codillac. Make a table kor these data, and drew a
ar graph. Draw a cick graph showing the percentage of the total mumber of cars
saples
fe) The model years kar saudt af the 30 cars are slwn bere:
95 99 95 97 86 92 96 97 89 92
83 92 99 87 S9 90 90 97 93 88
93 95 84 95 76 96 88 99 96 93
Make a freguney talla, histegram, and a fregenry polygon for thee data (ue live
clses). Describe the shape of the histogram.
(4) Consider the data types: nominal, andinal, laterval, et zatio. In part (b), what type of
lata do we have? Conld sn make a histogram for thee data? In part (c), what type
of data do we have? Cauld you onganize these data in a tirce graph
Expert Solution
This question has been solved!
Explore an expertly crafted, step-by-step solution for a thorough understanding of key concepts.

Step by step
Solved in 5 steps with 4 images

Recommended textbooks for you
Algebra & Trigonometry with Analytic Geometry
Algebra
ISBN:
9781133382119
Author:
Swokowski
Publisher:
Cengage

Holt Mcdougal Larson Pre-algebra: Student Edition…
Algebra
ISBN:
9780547587776
Author:
HOLT MCDOUGAL
Publisher:
HOLT MCDOUGAL

College Algebra (MindTap Course List)
Algebra
ISBN:
9781305652231
Author:
R. David Gustafson, Jeff Hughes
Publisher:
Cengage Learning
Algebra & Trigonometry with Analytic Geometry
Algebra
ISBN:
9781133382119
Author:
Swokowski
Publisher:
Cengage
Holt Mcdougal Larson Pre-algebra: Student Edition…
Algebra
ISBN:
9780547587776
Author:
HOLT MCDOUGAL
Publisher:
HOLT MCDOUGAL
College Algebra (MindTap Course List)
Algebra
ISBN:
9781305652231
Author:
R. David Gustafson, Jeff Hughes
Publisher:
Cengage Learning

College Algebra
Algebra
ISBN:
9781305115545
Author:
James Stewart, Lothar Redlin, Saleem Watson
Publisher:
Cengage Learning
