Q1/ The following data represents the SiO2 grade in %; construct frequency table and calculate mean, standard deviation, and coefficient of variation: 2.5 2.4 2.3 2.5 2.0 2.7 2.2 2.4 2.6 2.5 2.5 2.5 2.42.6 2.9 2.7 2.5 2.8 2.4 2.6
Q1/ The following data represents the SiO2 grade in %; construct frequency table and calculate mean, standard deviation, and coefficient of variation: 2.5 2.4 2.3 2.5 2.0 2.7 2.2 2.4 2.6 2.5 2.5 2.5 2.42.6 2.9 2.7 2.5 2.8 2.4 2.6

Glencoe Algebra 1, Student Edition, 9780079039897, 0079039898, 2018
18th Edition
ISBN:9780079039897
Author:Carter
Publisher:Carter
Chapter10: Statistics
Section10.4: Distributions Of Data
Problem 19PFA

Related questions
Question
i need the answer quickly
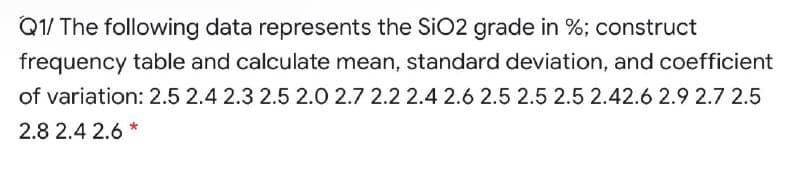
Transcribed Image Text:Q1/ The following data represents the SiO2 grade in %; construct
frequency table and calculate mean, standard deviation, and coefficient
of variation: 2.5 2.4 2.3 2.5 2.0 2.7 2.2 2.4 2.6 2.5 2.5 2.5 2.42.6 2.9 2.7 2.5
2.8 2.4 2.6 *
Expert Solution
This question has been solved!
Explore an expertly crafted, step-by-step solution for a thorough understanding of key concepts.

Step by step
Solved in 5 steps with 6 images

Recommended textbooks for you
Glencoe Algebra 1, Student Edition, 9780079039897…
Algebra
ISBN:
9780079039897
Author:
Carter
Publisher:
McGraw Hill
Glencoe Algebra 1, Student Edition, 9780079039897…
Algebra
ISBN:
9780079039897
Author:
Carter
Publisher:
McGraw Hill