For the following data set, approximate the sample standard deviation frequency table shows phone calls per day Phone calls per day Frequency 8- 11 18 12 - 15 23 16 - 19 38 20 - 23 47 24 - 27 32
For the following data set, approximate the sample standard deviation frequency table shows phone calls per day Phone calls per day Frequency 8- 11 18 12 - 15 23 16 - 19 38 20 - 23 47 24 - 27 32

Glencoe Algebra 1, Student Edition, 9780079039897, 0079039898, 2018
18th Edition
ISBN:9780079039897
Author:Carter
Publisher:Carter
Chapter10: Statistics
Section10.5: Comparing Sets Of Data
Problem 13PPS

Related questions
Question
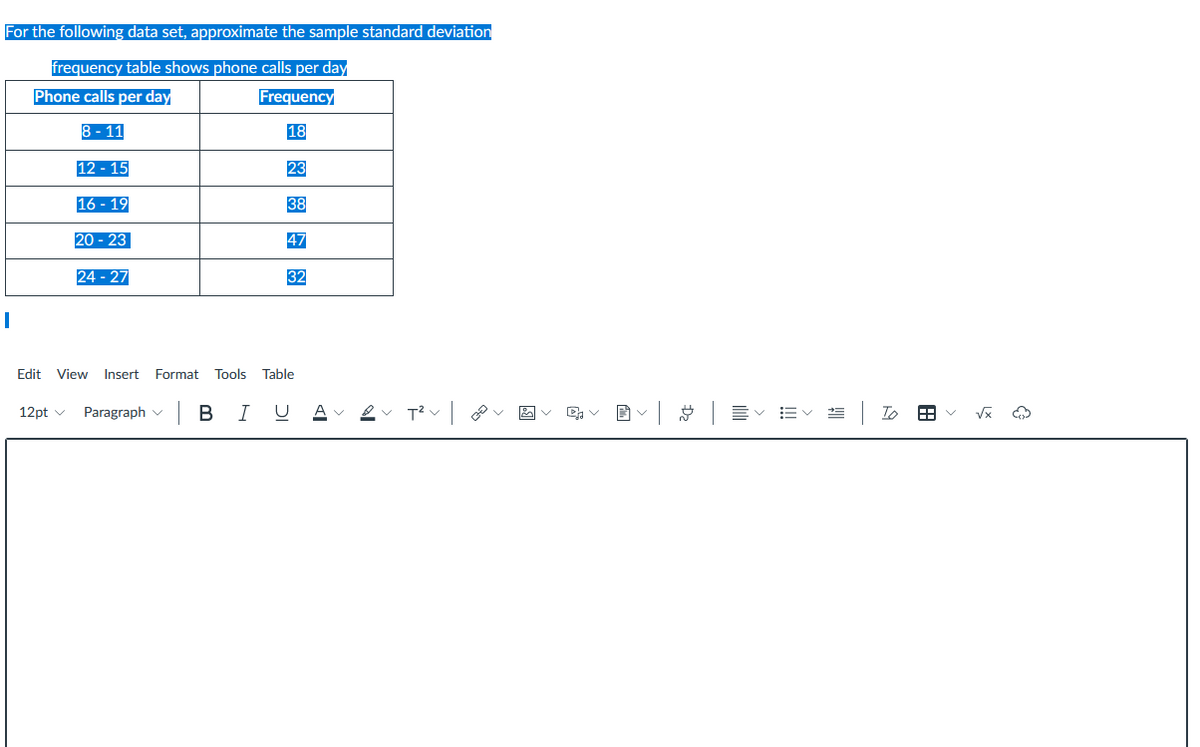
Transcribed Image Text:For the following data set, approximate the sample standard deviation
frequency table shows phone calls per day
Phone calls per day
Frequency
8 - 11
18
12 - 15
23
16 - 19
38
20 - 23
47
24 - 27
32
Edit View Insert Format Tools Table
Paragraph v
| B
I
= | To
12pt v
I!!
Expert Solution
This question has been solved!
Explore an expertly crafted, step-by-step solution for a thorough understanding of key concepts.

This is a popular solution!

Trending now
This is a popular solution!

Step by step
Solved in 2 steps with 2 images

Recommended textbooks for you
Glencoe Algebra 1, Student Edition, 9780079039897…
Algebra
ISBN:
9780079039897
Author:
Carter
Publisher:
McGraw Hill
Glencoe Algebra 1, Student Edition, 9780079039897…
Algebra
ISBN:
9780079039897
Author:
Carter
Publisher:
McGraw Hill