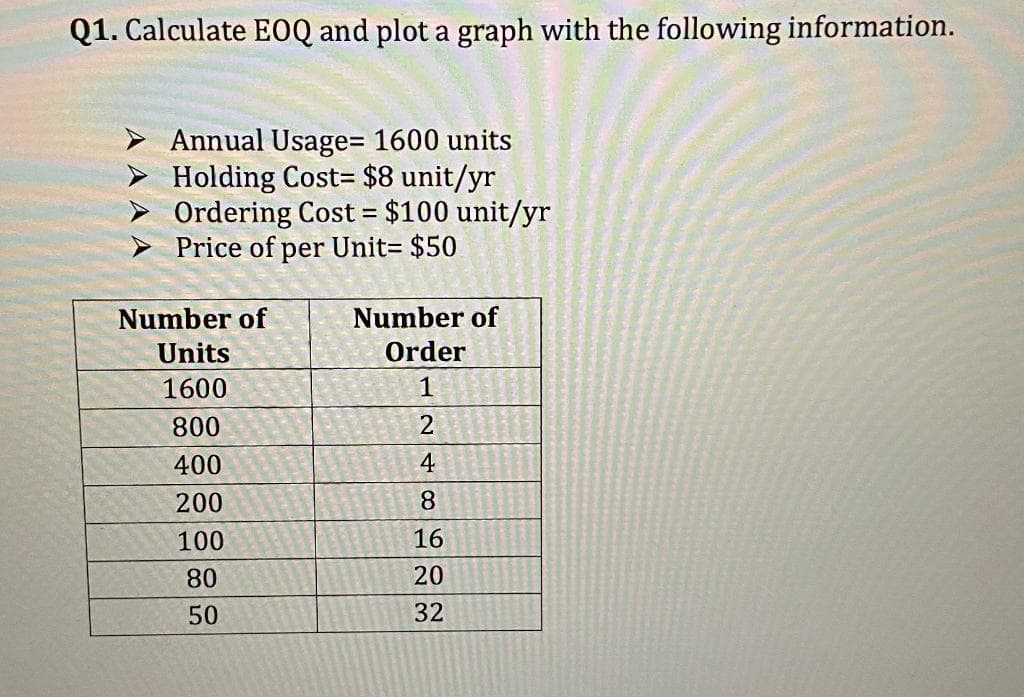
Q1. Calculate EOQ and plot a graph with the following information. Annual Usage= 1600 units Holding Cost $8 unit/yr Ordering Cost = $100 unit/yr Price of per Unit= $50 Number of Units 1600 800 400 200 100 80 50 Number of Order 1 2 4 8 16 20 32


Q: Consider a hybrid vehicle with a price of $30,000. This vehicle will average 30 miles per gallon of…
A: Information provided: Hybrid Vehicle: The price is $30,000 The average miles per gallon of gasoline…
Q: Briefly explain the “Dodd Frank Act” and its impact on the Financial Sector and consumer. (250 w
A: The financial sector is composed of the sectors that covers up a number of transactions in areas…
Q: why is Universal Basic Income not inflationary?
A: Inflation is the rate at which prices rise over a given time period. Inflation is typically defined…
Q: Course: Microeconomics Consider a consumer who has income equal to 100 and who faces prices Px = 2…
A: Budget constraint: given the price of 2 goods and consumer’s income. The budget constraint shows…
Q: Many police officer positions require the applicant to have a college degree, even though the tasks…
A: Discounting is the process of computing the present worth of a payment or a stream of payments that…
Q: Message from our expert: Our experts need more information to provide you with a solution. Please…
A: Barbados' historical and cultural fabric is intricately woven with sugar. Barbados has relied on…
Q: What is fiscal policy? Distinguish between a discretionary fiscal policy and a non- discretionary…
A: Fiscal policy is characterized as the strategy under which the public authority utilizes the…
Q: Suppose the quantity supplied falls, relative to the values given in the table above, by 20 million…
A:
Q: a. With the aid of appropriate diagrams, evaluate and illustrate the conditions required for…
A: A strategy plan called utility maximization aims to make people's and businesses' economic choices…
Q: You are researching the options for pricing the courses. Your goal is to achieve maximum revenue to…
A: Since you have asked for multiple subparts, we would be answering the first 3 for you. To get the…
Q: As more firms enter the market: O the short-run market supply curve shifts to the left. the…
A: The market place is the path that is providing an opportunity for trade. Here, the consumers and the…
Q: The intention of deregulating markets such as air passenger transport in the late 1980s and early…
A: Since you have asked multiple questions, we will solve the first question for you. If you want any…
Q: A mining company CEO wants to help provide college education for the daughter of a high performance…
A: Given First 4 years, (beginning on the fourth birthday) the annual cash flow is $-750. Annual cash…
Q: In 1970 a movie ticket cost US$2.00. Today, a movie tickets costs NZ$15.00 You also have the…
A: CPI (Consumer Price Index) determines the change in the prices of the products and services…
Q: nterest rates are usually ________ during the latter stages of a downswing in the South African…
A: Introduction Business cycles are intervals of expansion followed by recession in economic activity.…
Q: Study the table below and answer the question that follows. Afghanistan US Carpets 100 500 Fighter…
A: Opportunity cost is the cost of producing one good in terms of other. Opportunity cost is used to…
Q: Interest rate 2% 4 6 8 10 Transaction demand for money $220 220 220 220 220 Asset demand for money…
A: Demand for money shows how much money people are willing to hold to buy goods and services.
Q: Provide strong arguments in favor of Universal Basic Income/Basic Income Guarantee.
A: Under the socio-political financial transfer idea known as universal basic income, the government of…
Q: On the day his grandson was born, a man deposited to a trust company a sufficient amount of money so…
A: Grandson will be receiving an amount of P 10,000 for 5 years starting after the 18th birthday. To…
Q: 1. What is BCCC's Willingness-to-Sell (as a per-ounce price)? 2. What will the negotiated price…
A: In economics, Willingness-to-Accept refers to a minimum monetary amount that а person is willing on…
Q: Directions: Plot the following hypothetical market demand and supply schedules for commodity X in a…
A: Equilibrium quantity is when there is no lack or surplus of a product in the market. Supply and…
Q: We are given the following information for UWI Land. At the start of the period, there are 334,250…
A: Given, Number of Employed = 334,250 Number of Unemployed = 15,750 Not in Labor Force = 150,000…
Q: Function u(x₁, x2) A. Consider a consumer whose preferences can be represented by Cobb-Douglas…
A: Note: “Since you have posted multiple questions, we will provide the solution only to the first…
Q: In rural or urban areas, why some economist suggested that we need to focus on the following…
A: A rural area, often known as the countryside, is a region of land that lies outside of urbanised…
Q: Protective tariffs are: maximum limits on the quantity or total value of specific products imported…
A: Tariffs are the trade restrictions against free trade
Q: 14. The figure shows the supply and demand for labor in the textile industry. In each of the…
A: Equilibrium in labor market is where the labor demand curve equals the labor supply curve. The…
Q: Suppose the information in the table is for a simple economy that produces and consumes only four…
A: The term economic growth describes the gradual expansion of an economy. The usual method for…
Q: If the equilibrium exchange rate changes so that it takes more dollars to buy a British pound, then:…
A: Equilibrium is achieved at the output level where Qs=Qd
Q: 1. Give an example of trade policy when it comes to sugar in the Caribbean?
A: A government's agreements, rules, and practices that influence commerce with other nations are…
Q: According to the Economics Policy Institute (Mishel and Wolfe, 2019) CEO pay has grown 940% since…
A: According to Adam Smith, the invisible hand is needed for the market to work efficiently. The…
Q: Engineers have suggested a new piece of machinery to boost the productivity of a certain manual…
A: The interest rate at which a project's benefits and costs, discounted over its life, are equal is…
Q: Some MPs are more interested in education policies than in childcare programs. The MPs propose that…
A: Human capital refers to the investment in skills, education, and health care of the human being.…
Q: State of Economy Probability T-Bills Phillips Pay-up Rubber-Made Market index Recession 0.2…
A: Given, State of the economy Probability T-Bills Philips Pay-up Rubber-Made Market Index…
Q: If the sample mean is 10, the standard deviation is 2 and the sample 004 0.1 O 0.2 0.3
A: Given that, Sample mean = 10 Standard deviation = 2 Sample size = 100
Q: which of the following statements is true? 1. the deadweight loss of a monopolist choosing…
A: The price discrimination refers to a practice of selling the same products to different customers at…
Q: 9. In the IS model, aggregate consumption is given by C = ā¿Ỹ + x(Y− Ỹ) where x denotes the marginal…
A: Consumption function is given as C = acY + x(Y-Y)Where x denotes to MPC
Q: Which of these would cause the value of the Euro to rise? a. A rise in the Euro zone inflation rate…
A: The inflation refers to the sustained and chronic rise in the general or average price level in the…
Q: All of the following statements about sticky prices are true except: Select one: a. for studying…
A: The theory of sticky wage refers to an economic concept that describes how wages adjust slowly to…
Q: QUESTION 15 Which of the following professions would we expect to have the highest economic profit?…
A: Answer to the question is as follows:
Q: Andry produces all-natural tote bags. She currently hires 20 workers who produce 240 bags a day. If…
A: The marginal product of workers measures the change in the total product due to a change in workers…
Q: Price adjust until quantity demanded equals quantity supplied.
A: Competitive market- It refers to to a market where many buyers and sellers meet and they have…
Q: 3. If a monopoly takes over 100% of a market previously operating under perfect * competition, the…
A: Monopoly market refers to the market structure where only single firm exists in the market. The…
Q: SCENARIO: Greater consumption of alcohol leads to more motor vehicle accidents and, thus, imposes…
A: A cost or usual benefit of an economic activity that is felt by a separate third party is known as…
Q: A risk neutral insurer offers to insure an individual with a wealth of 25 dollars against a loss of…
A: Given information Initial wealth=25 Loss=21 For A-- Loss probability=0.33 and no loss=0.66 For B ---…
Q: An increase in consumer confidence combined with an increase in nominal wages will Question 25…
A: The consumer confidence index determines the measure of expectations. When t rises, consumers expect…
Q: Interior resources purchased land for 14,082,000 which their experts believe to contain 27.7 million…
A: One barrel of oil requires two tonnes of tar sands to be produced. Compared to traditional oil…
Q: The amount by which tax revenues exceed government expenditures during a particular year is the:…
A: Tax revenues is the total collection of the tax a government gets in an particular year. Government…
Q: Briefly explain the “Glass Steagall Act” and its repeal and its impact on the Financial Sector and…
A: The banking institution plays a pivotal role in the financial system. The people of an economy put…
Q: A utility company is considering the following plans to provide a certain service required by…
A: Plan Q Investment required - P500,000 Estimated life - 18 years Salvage value - 20% Annual…
Q: In the figure, demand is given by the formula p = 100 - Q/1000, where p is price and Q is quantity…
A:

Step by step
Solved in 3 steps with 1 images


- ENGINEERING ECONOMICSIt costs P500,000 at the end of each year to maintain a section of Kennon Road in Baguio City. If money is worth10%, how much would it pay to spend immediately to reduce the annual cost to P100,000?a. List the given variablesb. Formula & Complete solutionChambers Company has just gathered estimates forconducting a break-even analysis for a new product.Variable costs are $7 a unit. The additional plant willcost $48,000. The new product will be charged $18,000a year for its share of general overhead. Advertisingexpenditures will be $80,000, and $55,000 will be spenton distribution. If the product sells for $12, what is thebreak even point in units? What is the break even pointin dollar sales volume?Question 7 (Breakeven Analysis) You decided to sell Only coffee using Nespresso machine during Ramadan The Nespresso Machine Cost is 3,000 SAR Every cup of coffee required one brown sugar that cost 0.5 SAR, one disposable cup costs 1.5 SAR, and one coffee capsule costs 3 SAR If you sell one coffee for 10 SAR Option 1 Option 2 No Employee Sales quantity = 1500 per month Selling Price 10 SAR per coffee One more Employee and his salary is 4000 Expected sales quantity = 2500 per month Selling Price 10 SAR per coffee What is the breakeven quantity? What is the breakeven quantity? What is the profit? What is the profit? Which option is better?
- Given EVM data, estimate the cost at completion of a project using the method "EAC based on combined cost and schedule performance." BCWS = $82.2M BCWP = $70.5M ACWP = $95.5M BAC = $105.5M A) $130M B) $150M C) $160M D) $170MA manufacturer plans to introduce a new type of shirt based on the following information. The selling price is $57.00; variable cost per unit is $18.00; fixed costs are $7800.00; and capacity per period is 500 units. a) Calculate the break-even point (i) in units (ii) in dollars (2 decimal places) (iii) as a percent of capacity b) Draw a detailed break-even chart. (You do not have to submit this part; just draw it for your own practice.) c) Calculate the break-even point (in units) if fixed costs are reduced to $7020.00 d) Calculate the break-even point (in dollars) if the selling price is increased to $78.00Need answe for Part D and E
- Eng eco. Q2 Consider the following data of a company for the year 1997:Sales = Rs. 1,20,000Fixed cost = Rs. 25,000Variable cost = Rs. 45,000Find the following:(a) ContributionA cloth manufacturing firm is deciding whether or not to invest in new machinery. The machinery costs $45,000 and is expected to increase cash flows in the first year by $25,000 and in the second year by $30,000. The firm’s current fixed costs are $9,000 and current marginal costs are $15. The firm currently charges $18 per unit. If the interest rate is 5% then the present value of the cash flows is Note:- Do not provide handwritten solution. Maintain accuracy and quality in your answer. Take care of plagiarism. Answer completely. You will get up vote for sure.BVM manufactured and sold 25,000 small statues this past year. At that volume, the firm was exactly in a breakeven situation in terms of profitability. BVM’s unit costs are expected to increase by 30% next year. What additional information is needed to determine how much the production volume/sales would have to increase next year to just break even in terms of profitability? (a) Costs per unit (b) Sales price per unit and costs per unit (c) Total fixed costs, sales price per unit, and costs per unit (d) No data is needed, the volume increase is 25, 000 + 25, 000(0.30) = 32, 500 units.
- Suzy's Temporary Employee (STE) business, located in a big city, can do an online criminal background check in-house for $3.38 per search with a fixed cost of $28,000. A third-party online security firm offered to do a similar security search for $9.50 per person with an annual service contract with STE. If STE's forecast is 2,700 searches next year, should STE continue to do the search in-house or accept the third-party offer? Use the Excel template Break-Even to determine the best decision. Round your answer for the breakeven quantity to the nearest whole number and round your answer for the amount of saving/loss to the nearest dollar. Breakeven quantity: searches Since the demand forecast of 2,700 searches is than the breakeven quantity, STE outsource the work. STE $ by outsourcing.The monthly demand for ice cream cans being manufactured by Mr. Rivera is 3,200 pcs.With a manually operated guillotine the unit cutting cost is Php 50.00. An electricallyoperated hydraulic guillotine was offered to him at a price of Php 300,000 and whichreduced by 30% the unit cutting cost. Disregarding the cost of money, how manymonths will Mr. Rivera be able to recover the cost of the machine if he decides to buynow? Engineering EconomicsA business invests $5000 and initially plans to achieve annual revenue of $1100/yr with $200/yr expenses (starting at the end of ar 1) for ten years. No market value if used for ten years. 1.If at the end of the sixth year, instead, the investment is sold for $1000, calculate the PW, FW and AW for a BTCF MARR of 12%. Is the investment a good one if used this way? Why?