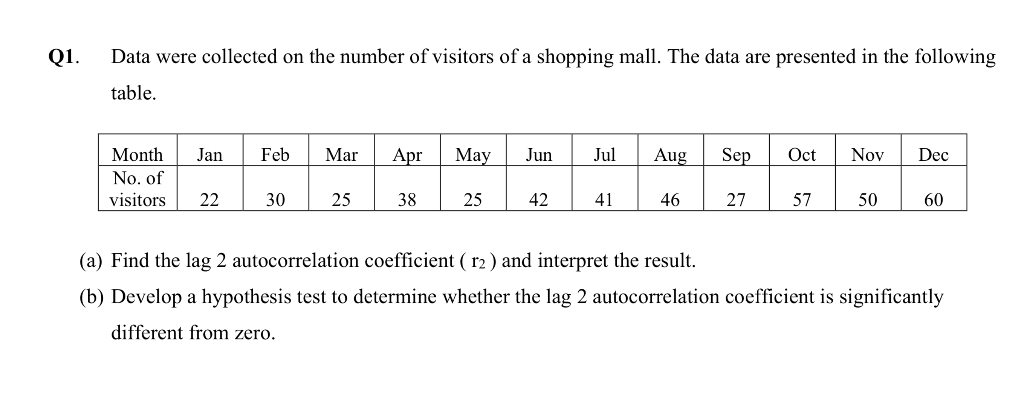
Q1. Data were collected on the number of visitors of a shopping mall. The data are presented in the following table. Month Jan Feb Mar Apr May Jun Jul Aug Sep Oct Nov Dec No. of visitors 22 30 25 38 25 42 41 46 27 57 50 60 (a) Find the lag 2 autocorrelation coefficient ( r2) and interpret the result. (b) Develop a hypothesis test to determine whether the lag 2 autocorrelation coefficient is significantly different from zero.


Q: A survey was conducted among the employees of a certain company and they were asked about their week...
A:
Q: Obtain the regression of demand on price from the following data and estimat demand when the price i...
A:
Q: Example Y,X 1 2 3 4 1/8 | 1/16 | 1/32 1/32 1/16 1/8 | 1/32 | 1/32 1/16 1/16 1/16 1/16 1/4 1 2 3 4
A: Hello! As you have posted more than 3 sub parts, we are answering the first 3 sub-parts. In case yo...
Q: - Draw a pie-chart to represent the following data relating to the production cost manufacture. Rs C...
A:
Q: Find mean deviation of the distribution given below : Persons having said number of accidents No. of...
A:
Q: Question ? When statisticians describe pooling the variances, they mean: taking the average of the t...
A: In this question it is basically asked that what actually pooled variance is:
Q: Next c A variable is normally distributed with mean 12 and standard deviation 2. a. Find the percent...
A:
Q: What is Mary's z-score in the following subjects?
A: Given: For statistics, μ=86σ=11raw score=89 For general mathematics μ=81σ=7raw score=87 For Pre- cal...
Q: Let X represent the number of tires with low air pressure on a randomly chosen car. The probability ...
A: X 0 1 2 3 4 P(X) 0.1 0.2 0.4 0.2 0.1
Q: 4. From the data given below, find out the value of Y when X 35 30 40 10 50 60 70 90 20
A: Use the Excel and Perform the Regression. Followings are the Steps to perform the Regression 1) Open...
Q: The mean height of students in a class is 152 cm. The mean height of boys is 158 cm with a standard ...
A:
Q: Draw a pie diagram to represent the following Male Female Girls Boys Total 2000 1800 4200 2000 10,00...
A: Given that Male 2000 Female 1800 Girls 4200 Boys 2000 Total 10000 We have to draw pi...
Q: Construct a binomial distribution graph for the number of defective computer chips in a lot of 3 if ...
A: Here given, n = 3 p = 0.5 q = 1-0.5 = 0.5
Q: If X(t) = Y cos@ t + Z sin@ t, where Y and Z are two independent normal RVs with E(Y) = E(Z) = 0, E(...
A:
Q: The odds against a certain event are 5 to 2 and the odds in favour of another (independent) event ar...
A: Odds is defined as the prob. of occurrence of an event divided by the prob. that the event will not ...
Q: If we draw 2 cards with replacement, what is the chance that the first draw is green and the second ...
A: A card deck contains cards of 4 colors: red, blue, green, and yellow. There are 20 of each color, fo...
Q: 3. P(B) = 0.4, P(A and B) = 0.18, find P(A | B) 4. P(A) = 0.35, P(B| A) = 0.1, find P(A and B)
A: We have to find given probability using Bayes theororm.
Q: Suppose that scores on a particular test are normally distributed with a mean of 120 and a standard ...
A:
Q: After the availability of covid 19 vaccinces in the Phiippines, the data below shows the number of s...
A:
Q: GetFood (a food delivery company) wants to investigate the customers ordering behavior on its' mobil...
A: The food delivery company GF collected a sample of 400 interarrival times (in seconds) of food order...
Q: X1,..., X, are independent, identically distributed RVs with mean u and variance g2. Find the mean o...
A:
Q: Liam's bowl of spaghetti contains n strands. He selects two ends at random and joins them together. ...
A:
Q: Suppose that the annual rate of return for a common biotechnology stock is normally distributed with...
A:
Q: Suppose that X has the following discrete distribution: x = 1,2,3,4 f(x) = {0.1x, = {*"o, 0, elsewhe...
A: Given discrete distribution is, fx=0.1x, x=1,2,3,4 x 1 2 3 4 f(x) 0.1 0.2 0.3 0.4 Graph of ...
Q: Use the method of least square to fit a trend line for the income from the following data. Estimate ...
A:
Q: QUESTION NO. 1 If 30% of the bolts produced by a machine are defective, determine the probability th...
A: For the given problems using binomial distribution
Q: A researcher hypothesized that children's cholesterol levels may be affected by educating their pare...
A: The z test is used to test whether there is any significant relationship between the sample and popu...
Q: 1. Samples of size n were randomly selected with replacement from populations with means and varianc...
A: 1) The mean and standard deviation are 6.9 and 2.1, respectively.
Q: A manufacturer knows that their items have a normally distributed lifespan, with a mean of 14.8 year...
A: GivenMean(μ)=14.8standard deviation(σ)=1.6
Q: Predict the salary for a graduate with 5 years of expe
A: Given information: Intercept=56.0786946 Experience coefficient=2.36826108 Regression Equation: Salar...
Q: The probability distribution of X = [X1, X2, ..., X,]' is given by the joint PDF f (x) = (27)¯P/2 e-...
A: Solution:
Q: Find the missing figure in the following data : Year 1950 1955 1960 1965 1970 Sales of Cloth 250 285...
A:
Q: The figure below is known as box-and-whiskers plot. 1. Are the sample distributions symmetrical? ...
A: Given two box-and-whiskers plots.
Q: If the correlation coefficient between hours spent studying and exam performance is -0.24, then what...
A: From the provided information, The correlation coefficient between hours spent studying and exam per...
Q: Compute the following probabilities. Round final answer to four decimal places. (d) The report that ...
A: Probability is the likelihood happening of an event. It is calculated by number of favorable cases a...
Q: Provide an appropriate response. If A, B, C, and D, are the ly possible outcomes of an experiment, f...
A: Solution
Q: MAKE A HISTOGRAM
A: Histogram is used to visualize the categorical variable. It helps to understand the spread of the da...
Q: 7) What must be the sum of the P(X) in the mean and variance of discrete random con variable? C. 100...
A: As per our guidelines we are supposed to answer only one question per post so I am solving first que...
Q: determined that the population of potential clientele have head diameters that are normally distribu...
A: Given : Population of potential clientele have head diameters that are normally dist. Mean (μ) = 6...
Q: Two hundred people were interviewed by a public opinion polling agency. The frequency distribution g...
A:
Q: The following data attained from a garden records of certain period Calculate the median weight of ...
A: Median : The median is the number in the middle of a sorted, ascending or descending list of numbers...
Q: Sketch a standard normal curve and shade the area that lies to the right of a. - 1.03, b. 0.6, c. 0,...
A: A continuous random variable Z is said to follow Standard Normal distribution if its probability den...
Q: (a) Set up a linear system whose solution provides the unknown flow rates. X3 25 - X4 = -600 = 550 X...
A: Given the network of traffic flow rate and we need to answer certain questions.
Q: ... a. The percentage of all possible values of the variable that lie between 7 and 16 is %. (Round ...
A: Here A variable is normally distributed with mean 11 and standard deviation 2 Here take variable as...
Q: A study was done to ascertain the effectiveness of a flu vaccine . Two groups of people ( vaccinated...
A:
Q: Given a RV 2 with density f(@) and another RV ø uniformly distributed in (- T, T) and independent of...
A:
Q: Calculate the mean and median from the following table : Class Intervals Frequency 6.5- 7.5 5 7.5- 8...
A: Class Frequency (f) Mid value (x) f⋅x cf 6.5-7.5 5 7 35 5 7.5-8.5 12 8 96 17 8.5-9.5 25 9...
Q: The manager of a company wants to check the inventory records against the physical inventories by a ...
A:
Q: Calculate the mean deviation (from median) from the following data : Class interval Frequency Class ...
A: Solution:
Q: The data below shows the overall miles per gallon (mpg) of 2021 small SUVs. What is the variance? ...
A: Given data is24,23,22,21,22,22,18,18,26,26,26,19,19,19,21,21,21,21,21,18,19,21,22,22,16,16

Step by step
Solved in 3 steps

- A suburban hotel derives its revenue from its hotel and restaurant operations. Theowners are interested in the relationship between the number of rooms occupied on anightly basis and the revenue per day in the restaurant. Below is a sample of 25 days(Monday through Thursday) from last year showing the restaurant income and numberof rooms occupied.. A study is conducted on the relationship of the number of absences (x) and the grades (y) of 15 students in BC212. Using r at 0.05 level of significance and the hypothesis that there is no significant relationship between absences and grades of the students in BC212, determine the relationship using the following data.r.05 = - 0.514Number of Absencesx Grades in BC212y122338614551219 908580758065709580807592898065a. In the analysis of a scatterplot, the element/s that should be considereddirectionstrength of correlationboth direction and relationshipnone of theseb. The important numerical value in hypothesis testing isparametersample valueconclusioninterpretation
- In a clinical trial, 29 out of 853 patients taking a prescription drug daily complained of flulike symptoms. Suppose that it is known that 2.9% of patients taking competing drugs complain of flulike symptoms. Is there sufficient evidence to conclude that more than 2.9% of this drug's users experience flulike symptoms as a side effect at the α=0.1 What is the test statistic z0?An experiment was conducted to test whether students’ performance (above or below average) is independent of stress level as a result of pressure on time table for the term in Hwanhwan Senior High School. The table below gives a 3 × 2 contingency table of the sample. Above Average Average Below Average Total Stressed 135 250 285 670 Not Stressed 150 157 107 414 Total 285 407 392 1084 With the help of chi-square test statistics, determine whether students' performance for the selected term in the school is independent of their stressed level experienced from the time table at α = 0.05A researcher is concerned that his new antihypertensive medication may be causing insomnia in some of his patients. Suppose he gathers an SRS of 65 patients treated with the study drug with a sample average of 6.6 hours of sleep and a σ=1.1. Assuming that insomnia can be quantified as an average of 4.5 hours of sleep, can we determine with 95% confidence that his drug avoids diagnosis of insomnia as a side-effect?
- The NAEP considers that a national average of 283 is an acceptable performance. Using α = .05, run a two-tail t-test for one sample to test Ho: µ=283 for the 2019 scores. Report the t-obt, df, and p-values. Would you reject the null hypothesis that the 2019 scores come from a population with average 283? If this is the case, does it come from a population from larger or smaller average?A researcher is using a two-tailed hypothesis test with α = .05 to evaluate the effect of a treatment. If the boundaries for the critical region are t = ± 2.080, then how many individuals are in the sample?Suppose a research study uses two independent groups with 21 individuals in each group. If a t-test analysis produces a calculated value of t of 1.68, which of the following is the correct decision?A. At the .05 level of significance, reject the null hypothesisB. At the .01 level of significance, reject the null hypothesisC. At the .05 level of significance, fail to reject the null hypothesisD. Impossible to answer without additional information
- A Canadian study measuring depression level in teens (as reported in the Journal of Adolescence, vol. 25, 2002) randomly sampled 112 male teens and 101 female teens, and scored them on a common depression scale (higher score representing more depression). The researchers suspected that the mean depression score for male teens is higher than for female teens, and wanted to check whether data would support this hypothesis. If μ1 and μ2 represent the mean depression score for male teens and female teens respectively, which of the following is an appropriate pair of hypotheses in this case? Check all that apply.A survey on lamb farms was conducted and data were collected on the followingvariables from a random sample of 30 farmers. Y = average live weight of ewes (kg)X1 = area of grazing land (m2) X2 = proportion of farm area that cannot be cultivatedX3 = proportion of area closed for lambs before weaningThe researchers reported:" A 2x2 ANOVA revealed, first of all, a main effect for depletion, indicating that depleted individuals generated less ideas (M = 9.40, SD = 5.64) than non-depleted individuals (M = 12.44, SD = 7.34), F (1, 108) = 6.03, p = .016, n2 = .05. This effect was qualified by the expected interaction with [perseverance], F (1,108) = 4.52, p = .036, n2 = .05". What size are the effects for the main effect of depletion and for the interaction between depletion and perseverance, according to Cohen's conventions? a. These are small- to -medium effects b. These are non existent effects c. These are large effects d. We are unable to tell from from the n2 / r2 statistics