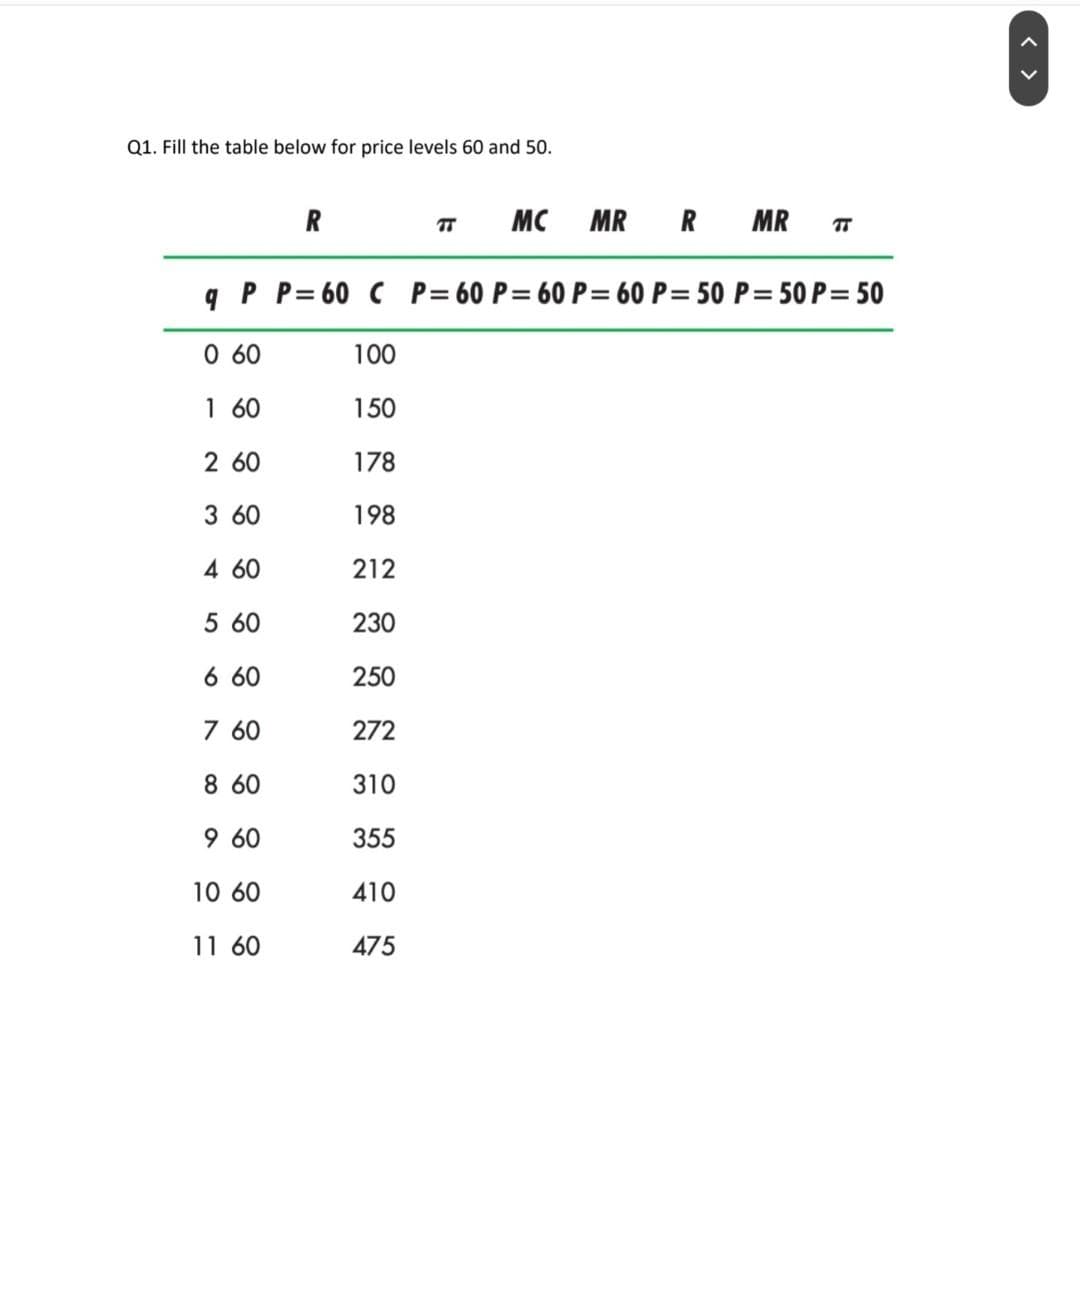
Q1. Fill the table below for price levels 60 and 50. TT MC MR R MR T qP P=60 C P=60 P=60 P=60 P = 50 P=50P = 50 0 60 1 60 2 60 3 60 4 60 5 60 6 60 7 60 8 60 9 60 10 60 11 60 R 100 150 178 198 212 230 250 272 310 355 410 475


Q: Which of the following correctly describes an external benefit resulting from an individual's…
A: Externality is the benefit or cost that will be born by third party. There is positive externality…
Q: (a)_Suppose we have preferences U(X, Y) = X² Y2.. What is the utility at the bundle X = 5 and Y =…
A: “Since you have posted a question with multiple sub-parts, we will solve first three subparts for…
Q: EMS company offers a deferred payment options for a split type air-conditioner with monthly payments…
A: Payment option provided - Amount = 5000 monthly Duration = 3 years = 36 months Annual Interest rate…
Q: A family has 15 members and has the following income data. $52,000, $22,000, $92,000, $8,000,…
A: Arrange the income in ascending order. $8,000 $14,000 $22,000 $26,000 $38,000 $46,000…
Q: could you please provide the maths used to detemine the answers in parts 4 and 5
A: Price discrimination occurs when a monopolist charges various prices to its customers while yet…
Q: If the calculation of the poverty line included the value of government programs as income, the…
A: The poverty rate of a country is merely and actually calculated basically on the basis of either…
Q: Using the following question: "Is the value of the final goods determined by the factors of…
A: The factors of production refer to the various resources like land, labor, capital, etc. that are…
Q: 7. Which of the following will result to a surplus in the financial account? a. Amount paid to…
A: Since you have posted multiple questions, we will provide the solution only to the first question as…
Q: Emeril owns his own restaurant, which earns a yearly total revenue of $1,100,000. The yearly cost of…
A: Explicit Cost: Explicit costs are out-of-pocket costs for a firm—for example, payments to labour,…
Q: Frank Mary Labor Hours Needed to Make 1 Unit of Beef 2 4 Pork 5 2 Number of Units Produced in 40…
A: Opportunity cost refers to the cost of best next forgone. It is the cost of the thing that has to be…
Q: hat causes shifts in the welfare of the unemployed in the one-sided search model? (Select all that…
A: A One-Sided Search Model of unemployment Spotlights on the way of behaving of a unemployed…
Q: The demand for hamburgers is given by Qd=10-p and the supply is Qs=4p-10, where pd and ps are,…
A: "Since you have posted a question with multiple subparts, we will solve first three subparts for…
Q: Explain how the Lorenz curve is used as a measure of Income Distribution. Is this a good tool? Why…
A: The Lorenz curve was created by American market analyst Max Lorenz in 1905. It is a graphical…
Q: A small island nation of Gondwana can produce either 40 Apple iPhones (Apple for short) or 80…
A: When a country is able to produce a certain good or to provide a service at a lower opportunity cost…
Q: As GDP rises in a proportional tax system, the average tax rate Select one: a) Either falls or…
A: When talking about proportional tax system, it can be said that it is the tax system in which…
Q: Which of the FF. statements is correct regarding the preference of the consumers when the income of…
A: An indifference curve shows the combinations of two goods or services that can get consumed such…
Q: The following question relates only to the equilibrium in the goods market IN A CLOSED ECONOMY and…
A: The international market is the market where a nation is involved in trade with multiple nations.…
Q: At an international meeting of consumer advocates for price control, a comparison of CPI growth was…
A: The overall change in the consumer priceswhich is based on represenative basket of services and…
Q: 3. Player 1 and Player 2 are going to play the following stage game twice: Top Bottom Left 4,3 0,0…
A: NE(Nash equilibrium) is used to achieve the best strategy in a non-cooperative game. NE doesn't…
Q: Janet Foster bought a computer and printer at Computerland. The printer had a $600 list price with a…
A: Cash discount received = Net amount payable* discount rate Total Interest paid = Amount borrowed*…
Q: Figure #1 P (S) 125 99 79 75 45 MR MC 99 D 139 Suppose that Figure #1 depicts the demand conditions…
A: Introduction Demand curve is a graphic representation of the relationship between product price and…
Q: Is MAClaim for comp MA lodged by the importer reasonable or not? 21910
A: >Here the exporting country is Brazil. >According to the contract the "If it suffers…
Q: Consider the graph above. Which is more elastic in equilibrium? The curves are equally elastic.…
A: Price elasticity calculates the percentage change in quantity demanded due to a percentage change in…
Q: Price level * Real GDP (1) O b.2 O c. 3 O d. 4 AD Price level Real GDP (2) AS AD AS * Real GDP (3)…
A: What is currency appreciation? A currency appreciation refers to the situation when the nominal…
Q: A two-product firm faces the demand and cost functions as follows. Q=40-2P+P₂, Q₂ =15+P-P₂, C=Q+99₂…
A: As given Demand and cost equations of two firms Q1 = 40 - 2P1 + P2 Q2 = 15 + P1 - P2 and cost…
Q: What has happened to real GDP per person in the industrialized countries over the past century? What…
A: The GDP per capita is an approximation of the total amount of goods and services available per…
Q: Explain why the industry supply curve is not the long-run industry marginal cost curve. The industry…
A: The marginal cost (MC) curve is defined as the change in total cost divided by the change in energy…
Q: Suppose you own a small business. Last month, your total revenue was $7,500. In addition, you paid…
A: Explicit costs are tangible expenses that show up in an firm's general ledger and are utilized to…
Q: 5. ConnBank has made two types of loans-A and B-each has the principal of $1. The probability of…
A: Expected value (EV) explains the long-run average level of a random variable based on its…
Q: Latest news shows that the local officer in Beijing are discussing increase minimum wage for cleaner…
A: Price control refers to the scenario when the government imposes a policy leading to set the minimum…
Q: Tax Bracket : 0-$20,000 = 10% $20,001-$60,000 = 15% $60,001-$100,000 = 35%…
A: Tax is the revenue earned by the government for the development of economy. Tax is calculated by…
Q: A bakery has an average fixed cost per bun of $1 and average variable cost of $1.60 at current…
A: The short run is the period of time when there are both fixed and variable factors. Variable Cost…
Q: Consider a machine that costs $40,000 and has a six-year useful life. At the end of the six years,…
A: Present value is the value of investment in today's dollar. Future value is the value of investment…
Q: In the quaint village of Chromaville, all of the residents (including their mayor) are colorblind.…
A: Consumer Equilibrium in economics is a state of maximum satisfaction/utility achieved. It is a…
Q: Consider the model of aggregate demand (AD) and supply in Chapter 10 of Mankiw 6e, which…
A: Aggregate demand refers to the sum of the demand for goods and services from all the sectors of an…
Q: Choose the corect statment(s). OA. The natural unemployment rate in the United States ranges between…
A: There are three types of unemployment, i.e., structural, frictional, and cyclical unemployment. The…
Q: Explain the concept ‘financial instability’ in Minsky’s frame work?
A: The financial instability hypothesis of Minsky's framework addresses the emergency of industrialists…
Q: Which of the following statements is not true? Externalities are those costs arising from production…
A: "Since multiple questions have been asked by you , we will solve first question .Please specify the…
Q: When making choices between spending or saving, how might these decisions impact the aggregate…
A: Introduction Income to a consumer is divided between spending and saving. From a personal point of…
Q: which of the following is not a type of dumping? O A. Pervasive. B. Persistent. C. Predatory. O D.…
A: When a nation exports a product in the foreign market at a price lower than the price at which it…
Q: Which of these explains why businesses seek more government regulation of market activity?…
A: A broad definition of regulation is the governmental imposition of guidelines backed by the use of…
Q: 17. Aggregate operations planners seek to match supply and demand at the minimum overall cost and:…
A: It is important for an organization to make a balance between demand and supply by holding an exact…
Q: Regarding the idea of laissez faire was there any difference between Adam Smith and the…
A: Laissez faire is a concept such that there will be no Government intervention in the economic…
Q: Suppose a firm's production function is: q = √KL. Assume capital is fixed at 4 units, and the rental…
A: Given Production function: q=KL Capital is fixed at K=4 it means the firm is in the short run…
Q: At an international meeting of consumer advocates for price control, a comparison of CPI growth was…
A: The overall change in the consumer priceswhich is based on represenative basket of services and…
Q: true or false The oligopolist reduces the price of the good by 10%, but the competitors reduced…
A: In an oligopoly sellers are few , therefore competition is high. If one firm increases the price the…
Q: Match the term with its definition. 1) abundance (n) a) to have or provide smth that is needed or…
A: The key economic terms includes scarcity, needs and wants, satisfy, goods and services, costs and…
Q: PART. Use the following information to answer all questions: the demand curve D(x)=-x² +8x+9, the…
A: Total revenue is the product of price and quantity. Profit is the difference between total revenue…
Q: 121 in the graph below, the firm is producing the quantity H. The marginal cost at the quantity His…
A: In economics and managerial accounting, marginal costing refers to an increase or decrease in total…
Q: Y2 Assume that neither country experiences population growth or technological progress and that 4…
A: The level of capital that is stable over time is known as k*( steady state level of capital). K* is…

Step by step
Solved in 3 steps with 2 images


- Cloud Cafe is considering the sale of promotional mugs. It can have the mugs produced by one of two suppliers. Supplier A will charge them a setup fee of Php13000 plus Php40 for each mug; Supplier B has no setup fee and will charge Php60 per mug. The company estimates its demand for mugs to be given by Q=32000-400P, where P is the price in Philippine peso and Q is the number of mugs (hint: the price equation is P=80-0.0025Q). In order to make sound decisions, the company's management asked the assistance of their student trainees from FEU in assessing the cost and revenue implications of the promotional campaign. 1. If the company wants to give the mugs away for free, how many mugs should it order? 2. What is the company's marginal cost if Supplier A is chosen? 3. What is the company's marginal cost if supplier B is chosen? 4. If the company seeks to maximize profit from selling mugs and Supplier A is chosen, how many mugs should the company order? 5. If the company seeks to maximize…A ski resort in the White Mountains has conducted market and cost studies, and has determined that the demand and supply for ski-lift tickets at their resort are represented by: Qd=1750 - 5P - 8PR + 2PB; Qs=50 + 20P - 3PE. In these equations, P represents the price of a full-day lift ticket, in dollars per ticket; PR is the price of a ski-rental package; PB is the price of a pint of beer at the local pub in the nearby town; and PE is the price per megawatt hour for the electricity used to run the chair lifts on the ski slopes. Based on the equations above, determine whether the beer in the local pub is a substitute or complement to skiing. Briefly explain your answer. Suppose the price of a ski-rental package is $20, the price of a pint of beer is $5, and the price of electricity is $150 per megawatt hour. Calculate equilibrium price and quantity of ski-lift tickets. Now consider the more general relationship between the price of lift tickets and the price of ski-rental packages.…If the gasoline price remains low and the gas engine becomes more efficient for all kinds of models, what will be the possible impact on the U.S. market price of Tesla Model X? Please explain your answer in the language of economics.
- If the demand and supply curves for a commodity are defined as follows, Qd=200-0.6(p) Qs=80+1.4(p) What would be the best option to represent the equilibrium price and equilibrium quantityWhat are the values of P1, P2, Q1, Q2 given two commodity demand and supply model: Q d1= 24 - 8 P1 + 2 P2 Q s1= - 6 + 12 P2 Q d2= 28 +P1 - 8 P2 Q s2 = - 6 + 2 P2insert a formula that calculates the percentage Raymond paid of the issue price by dividing the amount Paid by the Issue Price.
- In 2012-2015, the price of jet and diesel fuel used by air freight companies decreased dramatically. As CEO of FedEx, you have been presented with the following proposals below to deal with the situation. Evaluate these alternatives in the context of the decision-making model. Make long-term contracts to buy jet fuel and diesel at a fixed price for the next two years and set shipping rates to a level that will cover these costs.What is an alternative method of solving the price gouging of masks?. use diagram to support.Please no written by hand A reserve price is a minimum price set by the auctioneer. If no bidder is willing to pay the reserve price, the item is unsold at a profit of $0 for the auctioneer. If only one bidder values the item at or above the reserve price, that bidder pays the reserve price. An auctioneer faces two bidders, each with a value of either $186 or $248, with both values equally probable. Without a reserve price, the second highest bid will be the price paid by the winning bidder. The following table lists the four possible combinations for bidder values. Each combination is equally likely to occur.
- The Government of a country has implemented a higher minimum wage in 57 cities and towns effective 1 January 2020. Describe how the new wage will benefit employees in the urban areas and discuss the consequences to the economy of the country.You plan to purchase a car for $28,000. Its market value will decrease by 20% per year. You have determined that the IRS-allowed mileage reimbursement rate for business travel is about right for fuel and maintenance at $0.485 per mile in the first year. You anticipate that it will go up at a rate of 10% each year, with the price of oil rising, influencing gasoline, oils, greases, tires, and so on. You normally drive 15,000 miles per year. What is the optimum replacement interval for the car? Your MARR is 9%.Suppose Hinterland has been a closed economy (meaning there is no immigration from foreign countries and no international trade). The current labor force has 4 million skilled workers and 8 million unskilled workers. Both types of labor have perfectly inelastic supply curves, and the current skilled-unskilled wage ratio is 2.5. The elasticity of demand of skilled labor is -0.4, while the elasticity of demand of unskilled labor is -0.1. Suppose Hinterland allows a brief period of immigration, during which time 1 million skilled workers and 4 million unskilled workers migrate to Hinterland. Suppose there are no other changes to the economy. Approximately what is the new skilled-unskilled wage ratio? (Hint: The percent change in the wage ratio is approximately equal to the percent change in the skilled wage minus the percent change in the unskilled wage.)