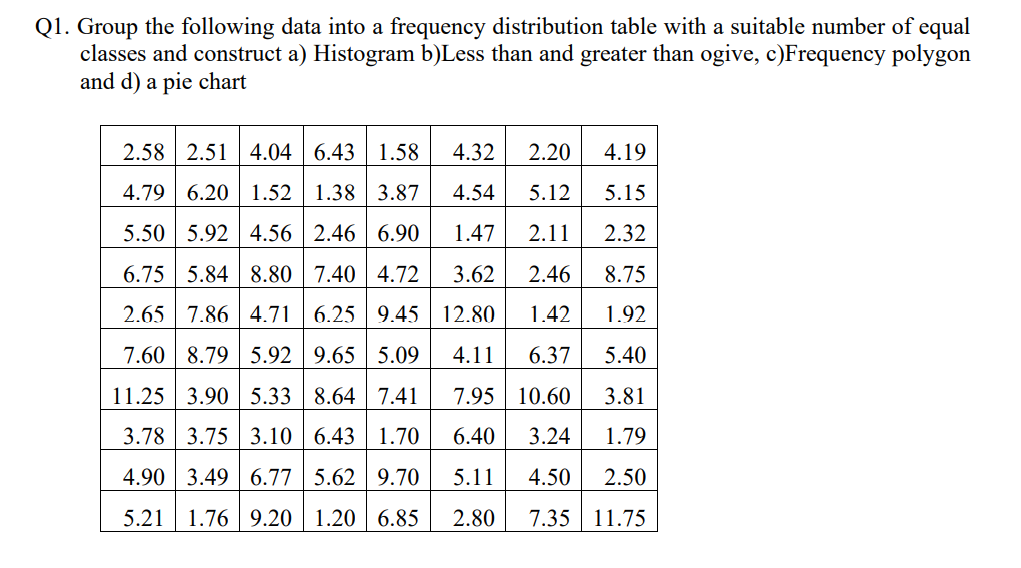
Q1. Group the following data into a frequency distribution table with a suitable number of equal classes and construct a) Histogram b)Less than and greater than ogive, c)Frequency polygon and d) a pie chart 2.58 2.51 4.04 6.43 1.58 4.32 2.20 4.19 4.79 6.20 1.52 1.38 3.87 4.54 5.12 5.15 5.50 5.92 4.56 2.46 6.90 1.47 2.11 2.32 6.75 5.84 8.80 7.40 4.72 3.62 2.46 8.75 2.65 7.86 4.71 6.25 9.45 12.80 1.42 1.92 760 8 79 5.92 9.65 5.09 4 11 637 5.40
Q1. Group the following data into a frequency distribution table with a suitable number of equal classes and construct a) Histogram b)Less than and greater than ogive, c)Frequency polygon and d) a pie chart 2.58 2.51 4.04 6.43 1.58 4.32 2.20 4.19 4.79 6.20 1.52 1.38 3.87 4.54 5.12 5.15 5.50 5.92 4.56 2.46 6.90 1.47 2.11 2.32 6.75 5.84 8.80 7.40 4.72 3.62 2.46 8.75 2.65 7.86 4.71 6.25 9.45 12.80 1.42 1.92 760 8 79 5.92 9.65 5.09 4 11 637 5.40

Glencoe Algebra 1, Student Edition, 9780079039897, 0079039898, 2018
18th Edition
ISBN:9780079039897
Author:Carter
Publisher:Carter
Chapter10: Statistics
Section10.6: Summarizing Categorical Data
Problem 4AGP

Related questions
Question
Transcribed Image Text:Q1. Group the following data into a frequency distribution table with a suitable number of equal
classes and construct a) Histogram b)Less than and greater than ogive, c)Frequency polygon
and d) a pie chart
2.58 2.51 4.04 6.43 1.58 4.32 2.20 4.19
4.79 6.20 1.52 1.38 3.87 4.54
5.12 5.15
5.50 5.92 4.56 2.46 6.90
1.47
2.11
2.32
6.75 5.84 8.80 7.40 4.72 3.62 2.46
8.75
2.65 7.86 4.71 6.25 9.45 12.80 1.42 1.92
7.60 8.79 5.92 9.65 5.09
4.11
6.37
5.40
7.95
10.60
3.81
6.40
3.24
1.79
11.25 3.90 5.33 8.64 7.41
3.78 3.75 3.10 6.43 1.70
4.90 3.49 6.77 5.62 9.70
5.21 1.76 9.20 1.20 6.85
5.11
4.50 2.50
2.80
7.35 11.75
Expert Solution
This question has been solved!
Explore an expertly crafted, step-by-step solution for a thorough understanding of key concepts.

Step by step
Solved in 2 steps with 4 images

Recommended textbooks for you
Glencoe Algebra 1, Student Edition, 9780079039897…
Algebra
ISBN:
9780079039897
Author:
Carter
Publisher:
McGraw Hill
Glencoe Algebra 1, Student Edition, 9780079039897…
Algebra
ISBN:
9780079039897
Author:
Carter
Publisher:
McGraw Hill