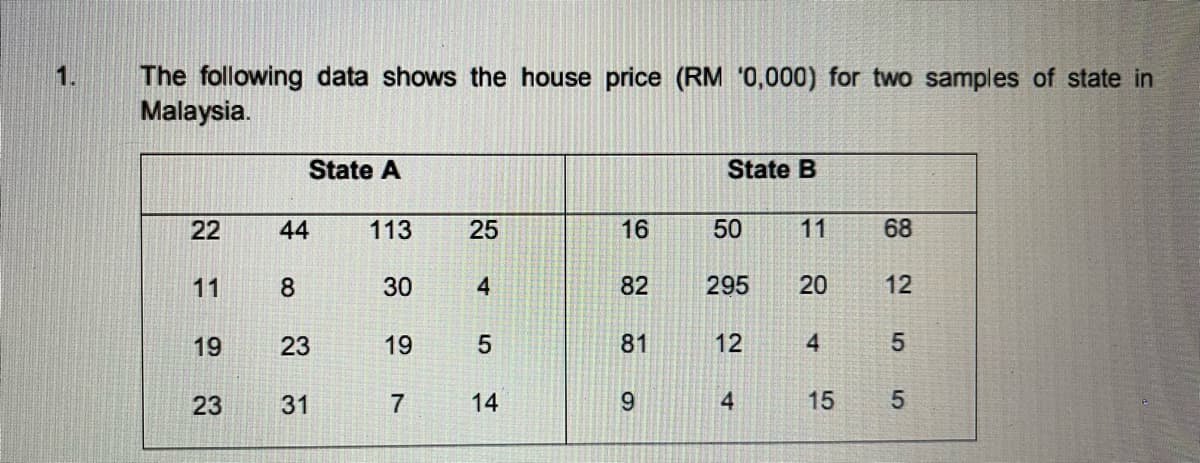
(a) A developer believes that the standard deviation of the house price is greater than RM230,000. At 5% significance level, is there enough evidence to support the developer's claim


Q: The average weight of insects for a laboratory experiment is 13.2 g with a standard deviation of 0.8…
A: From z tables, we get the p value
Q: The lengths of time (in years) it took a random sample of 32 former smokers to quit smoking…
A: The hypothesized mean is 13.
Q: Find the five number summary and draw the box plot for the following 24 10 4 20 40 58 26 39 7 11 100…
A: Solution-: (a) Find five number summary and draw the box plot for Given data (1) : 24, 10, 4, 20,…
Q: (c) Using the 99 percent confidence interval, can we be 99 percent confident that is at least 50…
A: Since we only do up to three sub parts of a problem, we'll be doing the first three subparts only.…
Q: (a) true (b) false 3. Variance is one type of measure (a) central tendency (b) standard numbers (c)…
A: 1. The sampling method is one of the methods of data collection. a. True. We are collecting the data…
Q: suppose that IQ scores in one region are normally distributed with a standard deviation of 18 .…
A: Given Standard deviations=18
Q: in a simple random sample of size 75, there were 19 individuals in the category of interest. It is…
A: From the provided information, Sample size (n) = 75 From which 19 individuals in the category of…
Q: Number of Tellers (X) P(X) 0.029 0 1 0.049 2 0.078 3 0.155 4 0.212 5 0.262 6 0.215 a. What is the…
A: The varable X denotes the number of tellers.
Q: 2. Using EXCEL or Google sheets, what is the correlation coefficient for this data? a. 0.934 b.…
A: 2) The linear correlation coefficient uisnsg Excel is obtained as follows: In Excel sheet, enter x…
Q: 35. At 8% level of significance, the most appropriate conclusion is that there is evidence that BMI…
A: Option :-C) No sufficient , associated From Above Output Use the Fishers exact test Because the…
Q: of their 16. Which of the following is(are) TRUE? * 1. PIX<266] = 0.50 II. The shape of the…
A:
Q: A study investigated the effectiveness of a new drug in lowering blood pressure. Subjects with mild…
A: Given Information: a) Group 1: Sample size n1=11 Sample mean x¯1=145.0 Sample standard deviation…
Q: A. Assuming that the total cost per day, C(x), is linearly related to the total output per day, x,…
A: here given , A company is planning to manufacture snowboards. The fixed costs are $300 per day and…
Q: A test has power 0.85 when u1=25. True or false: the probability of making a correct decision when…
A: Statisticians determine the power of a statistical test to see how well the test avoids TypeII…
Q: Tire pressure monitoring systems (TPMS) warn the driver when the tire pressure of the vehicle is 24%…
A: Given that: Target tire pressure = 30 psi Standard deviation, σ=3 psi
Q: applicants to take the Medical College Admission Test (MCAT). Scores on the MCAT are…
A: Given Data : Population Mean,μ = 25 Population Standard Deviation,σ = 6.5
Q: 33. Say the computed measure of associati following is(are) TRUE about the relationship and quality?
A: The correlation coefficient value will always lies between 0 and 1 r = cov(x,y)σxσycov(x,y) =…
Q: Write the statement showing the relationship between the two variables. Answer 3 and 4 sub units…
A: Correlation: Correlation a measure which indicates the “go-togetherness” of two data sets. It can be…
Q: A vero Beach city official would likely to estimate the average monthly rent of all rental units in…
A: Confidence interval is an interval such that the probability of the unknown parameter to be included…
Q: 22. Which of the following is(are) TRUE? * I. The sample mean difference in the resting heart rate…
A: Given that a kinesiologist claims that the resting heart rate of women aged 18 to 25 who exercise…
Q: Write an equation for the line passing through the given pair of points. Give the final answer in…
A: Points =(-5,0)&(0,4) 1. We have to calculate slope intercept form of line Y=mx+c 2. We have to…
Q: A researcher wanted to know whether the level of frustration over high gas prices differed for…
A: Hypothesis test are used to determine the population by taking sample and compare them. Each…
Q: 7.37. U₁, U₂ are independently and uniformly generated between 0 and 1 by a machine. Let X denote…
A: Given that: U1 and U2~Uniform0,1 Sum, X=U1+U2 Let Y = 1- U2
Q: Problem #3: A high-risk group of 732 male volunteers was included in a major clinical trial for…
A:
Q: Suppose that 16% of the population of the U.S. is left-handed. If a random sample of 175 people from…
A: Given n=175 P=0.16
Q: Use the normal distribution and the given sample results to complete the test of the given…
A: Given that Level of significance (α) = 5% = 0.05 Null hypothesis H0 : p=0.5 Alternative hypothesis…
Q: probability that this sample will have an average score between 21 and 26?
A: Given Data : Population Mean,μ = 25 Population Standard Deviation,σ = 6.5
Q: A market research firm reported that the mean annual earnings of all family practitioners in the…
A: From the provided information, Sample size (n) = 38 Sample mean (x̄) = 198513 Sample standard…
Q: 1. The mean serum level measured in 12 patients twenty-four hours after they received a newly…
A: Since you have asked multiple question, we will solve the first question for you. If you want any…
Q: A courier service claims that only 5 % of all its deliveries arrive late. Assuming deliveries are…
A: Note: As per guidelines we are supposed to solve only first three sub parts. Please repost the other…
Q: Y hav density function f(y) = determine E(Y) and E(Y²) П (атв) ya-ı Г(а) ГСВ) (тузатво yo
A:
Q: A soft drink vending machine is adjusted so that on average, it will automatically dispense 200 mL…
A: Given,sample size(n)=35sample mean(x¯)=195population standard deviation(σ)=14α=0.05
Q: The accompanying data were collected from a statistics class. The column heads give the variable,…
A: A new variable is created that classifies a student as a freshman and not a freshman.
Q: For a non-parametric between sample analysis, you use: A. Wilcoxon B. Paired t-test C. Mann…
A: The objective is to identify the non-parametric test between two samples:
Q: 2. A factory has a machine that dispenses 80 ml of fluid in a bottle. The head of the production…
A: Claim : the average amount of fluid is not 80 ml.
Q: A newborn baby is classified as having Extremely Low Birth Weight (ELBW) if it weighs less than 1000…
A: It is given that the mean is 815 and standard deviation is 100.
Q: Do men take a different amount of time than women to get out of bed in the morning? The 51 men…
A:
Q: In two sets of variables X and Y with 50 observations each, the following data were observed X =…
A: Mean of X =10 Standard Deviation of X=3 Mean of Y=6 Standard Deviation of Y=2 The cc between X and Y…
Q: A survey about timekeeping might divide the population by time zone, then take 100 random samples…
A: Solution: Stratified random sampling: Stratified random sampling is a type of probability or random…
Q: Suppose the National Transportation Safety Board (NTSB) wants to examine the safety of compact…
A: The question is about ANOVA Given :
Q: Let the 2-dimensional random variables (X, Y) have joint uniform density function f(x,y) = ²,0≤x≤3,…
A:
Q: Suppoose the p-value for a hypothesis is 0.0305. Using a 0.05, what is the appropriate conclusion?…
A:
Q: r the data above, what is the pooled variance? (Hint: you must first find the variance for each )
A: Given : For group A given data : 12,10,7,7,8,5
Q: This variable should be tested for Normality? A. Predictor B. Outcome
A: Dependent variable and independent variable: The variable of interest, regarding which, the…
Q: You may need to use the appropriate appendix table or technology to answer this question. Consider…
A:
Q: A student did a survey on the age of marriage for married male and female students. Use the…
A: Given data set is:
Q: The burning life (in hours) of electric lamps installed in a street of a city follows a normal…
A: Given: μ = 120 hours = 60×120 minutes=7200minutes σ2 = 54000 minutes. Formula Used: Z-score = X-μσ…
Q: Suppose that we will take a random sample of size n from a population having mean and standard…
A: Here given sample size , population mean and population standard deviation from which calculating…
Q: 8. A Pearson's r correlation coefficient that is equal to 0.49 means that: - O The degree or…
A: Solution :- The degree or strength of the influence of one variable towards the variable is moderate…
Q: How many degrees of freedom are there? Question 20 options: 52 50 33
A: Given : sample size , n = 51

Step by step
Solved in 2 steps with 1 images

- Assume the samples are random and independent. In a survery of 9300 twelfth grade males, 2083 said they had smoked in the last 30days. In a survey of 4900 twelfth-grade females, 985 said they had smoked in the last 30 days. At alpha=0.01, can you support the claim that the proportion of twelfth grade females who said they had smoked in the last 30 days is less than the proportion of twelfth grade females who said they had smoked in the last 30days?According to the National Health and Nutrition Examination Survey (NHANES) sponsored by the U.S. government, a random sample of 712 males between 20 and 29 years of age and a random sample of 1,001 males over the age of 75 were chosen and the weight of each of the males were recorded (in kg). Do the data provide evidence that the younger male population weighs more (on average) than the older male population? Use “Y” for ages 20-29 and “S” for ages 75+. It was found that x̅Y=83.4, sY=18.7, x̅S=78.5, and sS=19.0. a) Is the normality condition met for this test? (see picture) No, since the histograms show skewness and outliers . Yes, since both sample sizes are larger than 30. No, since both sample sizes, nY and nS, are less than 30. Yes, since it was stated that the two populations are normally distributed. b)What are the correct degrees of freedom for this test? Group of answer choices 999 1000 1712 1711 711According to the National Health and Nutrition Examination Survey (NHANES) sponsored by the U.S. government, a random sample of 712 males between 20 and 29 years of age and a random sample of 1,001 males over the age of 75 were chosen and the weight of each of the males were recorded (in kg). Do the data provide evidence that the younger male population weighs more (on average) than the older male population? Use “Y” for ages 20-29 and “S” for ages 75+. It was found that x̅Y=83.4, sY=18.7, x̅S=78.5, and sS=19.0. a)Suppose the test statistic is t = 2.398. What is the associated p-value? Group of answer choices 0.001 < p-value < 0.002 0.005 < p-value < 0.01 0.01 < p-value < 0.02 0.0005 < p-value < 0.001 b) Suppose the p-value is 0.02 < p-value < 0.04. At α = 0.10 what is the appropriate conclusion to make? Group of answer choices Fail to reject H0 and conclude that the mean weight of all males ages 20-29 is greater than the mean weight of all…
- According to the National Health and Nutrition Examination Survey (NHANES) sponsored by the U.S. government, a random sample of 712 males between 20 and 29 years of age and a random sample of 1,001 males over the age of 75 were chosen and the weight of each of the males were recorded (in kg). Do the data provide evidence that the younger male population weighs more (on average) than the older male population? Use “Y” for ages 20-29 and “S” for ages 75+. It was found that x̅Y=83.4, sY=18.7, x̅S=78.5, and sS=19.0. A) What are the correct null and alternative hypotheses? B)What is the parameter of interest? The difference between the mean weight of all males ages 20-29 and the mean weight of all males ages 75+ The mean weight (in kg) The difference between the mean weight of the sample of males ages 20-29 and the mean weight of the sample of males ages 75+ The mean difference between the weights of males ages 20-29 and males ages 75+ c)Is the randomness condition met for…Two subspecies of dark-eyed juncos were studied by D. Cristol et al. One of the sub- species migrates each year, and the other does not. Several characteristics of 14 birds of each subspecies were measured, one of which was wing length. The following data, based on the results of the researchers, provide the wing lengths, in millimeters, for the samples of two subspecies. Assume that wing lengths in populations of subspecies are normally distributed.Migratory: n = 14, x ̄ = 82.1, s = 1.5 111Non-migratory: n = 14, x ̄ = 84.92, s = 1.69 222Conduct a hypothesis test to determine if the average wing lengths in two populations of subspecies are significantly different.(i.) State the hypotheses.(ii.) Test for equality of unknown population variances. (iii.) Calculate test statistic.(iv.) Calculate degrees of freedom.(v.) Calculate the p−value of the test.(vi.) State your decision based on the p−value.(vii.) Write the interpretationA manufacturer of children’s vitamins claims that its vitamins are mixed so that each batch has exactly the following percentages of each color: 40%green, 20% yellow, 20% red, and 20% orange. To test the claim that these percentages are incorrect, 100100 bottles of vitamins were sampled and the colors of the vitamins were tallied. The results are listed in the following table. At α=0.005, determine whether there is sufficient evidence to conclude that the percentages stated by the vitamin manufacturer are incorrect. Children's Vitamins Green Yellow Red Orange Number 1511 728 793 837 Copy Data Step 3 of 4 : Compute the value of the test statistic. Round any intermediate calculations to at least six decimal places, and round your final answer to three decimal places. Step 4 of 4: draw conclusion and interpret the decision (is there enough evidence?)
- Suppose an experiment finds that people taking a new herbal remedy get fewer colds than people taking a placebo. The results are statistically significant at the 0.01 level. Has the experiment proven that the herbal remedy works?The table below shows a sample of waiting times (in days) for a heart transplant for two age groups. At α=0.05, can you conclude that the variances of the waiting times differ between the two agegroups?The table below shows a sample of waiting times (in days) for a heart transplant for two age groups. At α=0.05, can you conclude that the variances of the waiting times differ between the two age groups?
- A manufacturer of children’s vitamins claims that its vitamins are mixed so that each batch has exactly the following percentages of each color: 10% green, 30%30% yellow, 30% red, and 30% orange. To test the claim that these percentages are incorrect, 100 bottles of vitamins were sampled and the colors of the vitamins were tallied. The results are listed in the following table. At α=0.025, determine whether there is sufficient evidence to conclude that the percentages stated by the vitamin manufacturer are incorrect. Children's Vitamins Green Yellow Red Orange Number 590 1765 1717 1615 Copy Data Step 1 of 4 : State the null and alternative hypotheses in terms of the expected proportion for each color of vitamin. H0: pgreen=⎯⎯⎯⎯⎯⎯⎯⎯⎯⎯⎯⎯⎯⎯⎯, pyellow=⎯⎯⎯⎯⎯⎯⎯⎯⎯⎯⎯⎯⎯⎯⎯, pred=⎯⎯⎯⎯⎯⎯⎯⎯⎯⎯⎯⎯⎯⎯⎯ porange=⎯⎯⎯⎯⎯⎯⎯⎯⎯⎯⎯⎯⎯⎯⎯Ha: There is a difference from the stated proportions.Suppose, the following results from a vaccine trial carried out during an epidemic.. Vaccine Status Recovery Death Vaccinated 1562 42 Unvaccinated 383 94 Describe the contingency table Analyze the data using appropriate statistical methods and describe your findings. Use alpha=0.05A survey of 90 recently delivered women on the rolls of a county welfare department revealed that 27 had a history of intrapartum or postpartum infection. Can we conclude that the population proportion with a history of intrapartum or postpartum infection is significantly less than or equal to 0.25? Let alpha = 0.05.


