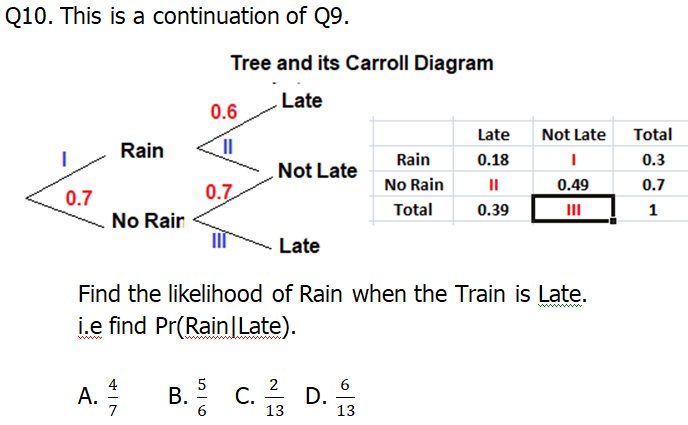
Q10. This is a continuation of Q9. Tree and its Carroll Diagram Late 0.6 Late Not Late Total Rain Rain 0.18 0.3 Not Late 07 No Rain II 0.49 0.7 0.7 Total 0.39 No Rair Late Find the likelihood of Rain when the Train is Late. i.e find Pr(Rain|Late). www 2 А. 7 С. 6 D. 13 13 B.


Q: Buuton 5: Expect alion and Varian ce Let X fe a oontinuous pan dom van'able and Y: a X + L you some ...
A:
Q: Explain how you could conduct a simulation to determine the probability of these situations. a. gues...
A: (a) Probability of guessing correct answer on at least 6 of 10 true/false questions.
Q: Problem : Determine the MTTF for a mission time of 1000 hours life if the test data on 10 such compo...
A:
Q: 1 1 3 4 P(x) 1/5 Find d and construct a probability histogram to describe P(x). d/25 9/25 2d/25 2/25
A:
Q: Find the Geometric mean of : 2, 4, 6, 8, 12, 14, 16, and 18.
A: We have given that, The data set is, 2, 4, 6, 8, 12, 14, 16, 18 Then, We will find the Geometric ...
Q: O Suppore twice Xesume mixed stratejos (ran domi zng the three actions) you have? and I play the gam...
A: Given: Suppose you and I play the game rock-paper-scissor twice. Assume mixed strategies (randomizin...
Q: According to a Louis Harris survey, 523 in a sample of 1028 female drivers reported that they never ...
A: Given data : x1= 523 n1= 1028 x2= 537 n2= 1178 significance level, 0.0...
Q: I1. A field of study contains 14,204 men and 17,811 women. A survey stratified with respect to gende...
A: Given Information: Number of men = 14204 Number of women = 17811 The sample size (n) = 750 Required...
Q: 2. Compute the confidence interval of population proportion. Among 1500 Filipino women included in a...
A: Given,n=1500x=765p^=xnp^=7651500=0.511-p^=1-0.51=0.49α=1-0.95=0.05α2=0.025Z0.025=1.96 (from Z-ta...
Q: In a population with o = 6, a score of X = 48 corresponds to z = 1.25. The mean for this population ...
A: From the provided information, Standard deviation (σ) = 6 Z value = 1.25 And X = 48
Q: Consider four possible combinations of sample size and treatment assignment rules. n=50, treatment ...
A: Decision based Confidence interval: If zero includes in the confidence interval, we fail to rejec...
Q: Problem : The life testing data of 1000 specimens of a particular device are given below. Determine ...
A:
Q: A lest consists of five questions and to pass the test, a student has to answer at least four questi...
A: Define the event of answering a question rightly as a success and the event of answering a question ...
Q: A bag has 2 baseballs (B), 5 tennis balls (T), and 3 whiffle balls (W) What is the probability of pu...
A: Probability of pulling out a tennis ball is 510 and the reduced fraction is 0.5 and 50%
Q: Define Karl Pearson's coefficient of correlation and discuss the methods of studying it?
A: Defined karl Pearson correlation coefficient
Q: Identify the lower class limits, upper class limits, Blood Platelet Count of class width, class midp...
A:
Q: 16. Fit a binomial distribution to the following data : 2 3 4 1 х : 10 4 62 46 28 f :
A:
Q: From the following data. Calculate Karl Pearsons co- eficient of Skewness: Class interval Frequency ...
A:
Q: If a researcher obtains a sample mean of M= 54, from a population with u = 46. With a given alpha, w...
A: Given, If a researcher obtains a sample mean of M= 54, from a population with u = 46.
Q: Problem: Which single sampling plan should be used for a lot size of 5000, an LTPD of 5% with a cons...
A:
Q: The probability that a trainee will remain with a company is 0.6. The probability that an employee e...
A:
Q: How do you you decide whether your a test is one, two, left or right tailed?
A: Any assumption about the parameter or probability function is known as Hypothesis testing (HT).
Q: Provide a brief description to the histogram below
A: Given
Q: (a) Below is the extract of the first few questions in the questionnaire. Define the type of variabl...
A: QI) As variable takes outcomes Business, Engineering, Arts or Science. Hence given variable is Cate...
Q: 11 If P(A) = , P(B) 3 and P(A U B) = 4 find (i) P(A/B), (ii) P(exactly one of A and B occurs). 12 (i...
A:
Q: Find the 80% confidence interval. Enter your answer as an open-interval (i.e., parentheses) accurate...
A: Confidence Interval: Let X1,X2,X3, ...Xn be a random sample from probability density function f(x...
Q: Suppose a borderline hypertensive is defined as a person whose DBP is between 90 and 95 mm Hg inclus...
A:
Q: From the following data construct Laspayres Price index number in 1989 with 1986 as base year. Commo...
A: We have given the following data Let p0 and q0 denotes the price and quantity of base year 1986 and...
Q: 51. The Pew Research Center finds that the demographic make-up of political parties is changing dras...
A: Formula : For independent event, P(A|B) = P(A)
Q: carpet manufacturing cleaning company has a seasonal pattern of daily mail volume every week. The fo...
A: Data given for week 1 & 2 We have to forcast the volume for each day of week if 30,000 piece to ...
Q: Distinguish between necessary and sufficient causes, giving examples.
A: Let NC denote necessary causes. Let SC denote sufficient causes.
Q: 6. The three samples below have been obtained from normal populations with equal variances. Test the...
A:
Q: Show your complete solutions The carbon monoxide (CO) level in a manufacturing plant is supposed to ...
A: Data given 58,64,63,48,52,68,70,54,57,61 Level of significance=ɑ=0.10 μ=50, σ=8.07
Q: Define the term System Service Rate?
A: Service System: It can be defined as A carrier system (or customer support system, CSS) is a configu...
Q: An x control chart with the 3-sigma control limits and sample size of n = 5 is used for monitoring a...
A:
Q: Calculate the co-efficient of correlation and the lines of regression for the following data: 1 2 3 ...
A:
Q: Table 3: Frequency distribution of Hwy MPG Cumulative relative frequency Relative Hwy MPG Tally Freq...
A: Frequency distribution table : A frequency distribution table is a graph that shows the frequency of...
Q: JExample 15-44. For the double Poisson distribution : p(x) = P(X = x) =! "1.m,* 1 e™2.m, x ! %3D x!;...
A:
Q: If the population standard deviation is unknown, then we could use the sample standard deviation to ...
A: We have given that the statement about the standard error of the mean. The formula of standard error...
Q: How many of the 3005 subjects used at least one prescription medication? Construct a 90% confidence ...
A: p=0.817 = probability of subject use at least one prescription n = 3005 = number of adults involved...
Q: From the following data. Calculate Karl Pearsons co- eficient of Skewness: Class interval Frequency ...
A:
Q: 1. A Random Variable X can take only two values, 1 and 2 .P(1) = 0.8 and P(2) = 0.2 Calculate the Ex...
A: Since you have asked multiple questions, we will solve the first question for you. If you want any s...
Q: Example 17-40. (a)Obtain the most general form of distribution differentiable in 8, for which the sa...
A:
Q: The joint probability density is for X and Y are f(x, y). Give the exact answer. f (x, у)— 2 ху 0 2...
A: Given,f(x,y)=2xy ; 0<x<1 , 0<y<2 , y>2x0 ; elsewhere
Q: C. Directions: Identify the sampling technique for each scenario. Write your answer on the space pro...
A: We have given the situations what to find that which type of sampling technique is used in particula...
Q: Discuss the way someone can perceive and consume statistical information experienced in everyday lif...
A:
Q: Find UCL, LCL for a 'c' chart when u. = 6.0 and u. = 12.5 with 0.995 and 0.005 probability limits.
A:
Q: Calculate mean deviation from (i) mean and (ii) Median for the following data. Also calculate co-eff...
A: Mean deviation are easily calculated and it involve all the observations in the data set. But it is ...
Q: dents passed a test in wnich the top three will get a prize. How many posSible ways are there to get...
A: Given that : Total student passed a test (n) = 10 Student get a prize (r) = 3 By using permutations...
Q: What is the distribution of ¯xx¯? ¯xx¯ ~ N(,) For the group of 7, find the probability that the aver...
A:
answer to this please

Step by step
Solved in 2 steps with 1 images

- Every morning, Tania leaves for work a few minutes after 7:00 A.M.. For eight days, she keeps track of the time she leaves (the number of minutes after 7:00) and the number of minutes it takes her to get to work. Following are the results: Time Leaving: 13 14 16 30 20 12 9 17 16 10 16 Lenght of Commute: 27 20 23 45 20 45 20 28 27 23 30 a. Construct a scatterplot of the lenght of commute (y) versus the time leaving(x). b. Compute the least-squares regression line for predicting the length of commute from the time leaving. c. Compute the coefficient of determintion.A consumer is given the chance to buy a baseball card for $1, but hedeclines the trade. If the consumer is now given the baseball card, willhe be willing to sell it for $1? Standard consumer theory suggests yes, butbehavioral economists have found that “ownership” tends to increase thevalue of goods to consumers. That is, the consumer may hold out for someamount more than $1 (for example, $1.20) when selling the card, eventhough he was willing to pay only some amount less than $1 (for example,$0.88) when buying it. Behavioral economists call this phenomenon the“endowment effect.” John List investigated the endowment effect in a randomized experiment involving sports memorabilia traders at a sports-card show. Traders were randomly given one of two sports collectibles, say good A or good B, that had approximately equal market value.1 Those receiving good A were then given the option of trading good A for good B with the experimenter; those receiving good B were given the option of…a) A grocer wishes to see whether the median number of itemsbought on each sale could be considered to be 10, so he observes 12customers at the checkout counter. b)Can the Wilcoxon test beused? c) Which assumptions of the model are violated in thisproblem? d)Solve using the Wilcoxon signed-ranks test. Customer Number of Items Customer Number of Items 1 22 7 15 2 9 8 26 3 4 9 47 4 5 10 8 5 1 11 31 6 16 12 7
- The owner of a pet store is trying to decide whether to discontinue selling specialty clothes for pets. She suspects that only 10% of the customers buy specialty clothes for their pets and thinks that she might be able to replace the clothes with more interesting and profitable items on the shelves. Before making a final decision she decides to keep track of the total number of customers for a day, and whether they purchase specialty clothes for their pet. a) Assuming the pet store owner is correct in thinking that only 10% of her customers purchase specialty clothes for their pets, how many customers should she expect before someone buys a garment for their pet? b) What is the probability that she does not sell a garment until the 5th customer? c) What is the probability that exactly 4 of the first 10 customers buy specialty clothes for their pet? d) What is the probability that at least 3 of the first 35 customers buy specialty clothes for their pet?…Suppose we are interested in analyzing the market share and customer loyalty for Murphy's Foodliner and Catalina's Supermarket, the only two grocery stores in a small town. We focus on the sequence of shopping trips of one customer and assume that the customer makes one shopping trip each week to either Murphy's Foodliner or Catalina's Supermarket, but not both. The data shows that of all customers who shopped at Murphy's in a given week, 90% shopped at Murphy's the following week while 10% switched to Catalina's. The data shows that of all customers who shopped at Catalina's in a given week, 80% shopped at Catalina's the following week while 20% switched to Murphy's. Suppose that we are considering the Markov process associated with the shopping trips of one customer, but we do not know where the customer shopped during the last week. Thus, we might assume a 0.5 probability that the customer shopped at Murphy's (State 1) and a 0.5 probability that the customer shopped at Catalina's…Suppose we are interested in analyzing the market share and customer loyalty for Murphy's Foodliner and Ashley's Supermarket, the only two grocery stores in a small town. We focus on the sequence of shopping trips of one customer and assume that the customer makes one shopping trip each week to either Murphy's Foodliner or Ashley's Supermarket, but not both. The data shows that of all customers who shopped at Murphy's in a given week, 90% shopped at Murphy's the following week while 10% switched to Ashley's. The data shows that of all customers who shopped at Ashley's in a given week, 80% shopped at Ashley's the following week while 20% switched to Murphy's. Suppose that we are considering the Markov process associated with the shopping trips of one customer, but we do not know where the customer shopped during the last week. Thus, we might assume a 0.5 probability that the customer shopped at Murphy's (State 1) and a 0.5 probability that the customer shopped at Ashley's (State 2) at…
- In each question, select ONE response from the provided alternative responses. Based on years of experience, an economics professor knows that onthe first principles of economics exam of the semester 13% of studentswill receive an A, 22% will receive a B, 35% will receive a C, 20%will receive a D, and the remainder will earn an F. Assume a 4 pointgrading scale A = 4, B = 3, C = 2, D = 1, and F = 0. Define therandom variable GRADE = 4, 3, 2, 1, 0 to be the grade of a randomlychosen student. What is the expected value of GRADE?A. 2.08B. 10C. 132. Suppose Y = 3X + 2. Given that E (X) = 8 and V ar (X) = 4, what isV ar (Y )?A. 36B. 26C. 38Compute the correlation coefficient between the random variables X and Y ,given the joint probability distribution below. X1 2Y 0 0.70 0.001 0.00 0.30 A. 0.6B. 1 6 C. 0.21 The following is a random sample of seven (x, y) pairs of data points: (1, 5) (3, 7) (4, 6) (5, 8) (7, 9) (3, 6) (5, 7)Use the data points to attempt Questions 34 − 37.34. Compute the…thomas is a shift manager at a local fast food place and is responsible quality management thomas wants ensure that each of the frozen hamburger patties that get delivered by the supplier weights four ounces on average assume that standerd devitation of the weight of hamburger patties is known to be 0.1 ounces thomas tells one of his employes that as a shipment comes in select 20 patties at random and the average weight for the 20 patties if the average weight is less than 3.95 ounces reject the shipment what is the smallest significate level assocaited with decision ruleIn what sense is the mean teh center of distributon? a.M is the center because half the sample scores are always above it and half are below b.M is center because it is always the most probable score in the sample c.M for the sample always equals micro for the population d.M is like a balance point because E (m-x)=0 for every sample.
- a pollster wnats to minimize the effect the order of the questions has on a person's response to a survey. how many different surveys are required to cover all possible arrangements if there are 9 questions on the survey?The Greer Tire company manufactures a new steel-belted radial tire to be sold through a national chain of discount stores. Because the tire is a new product, Greer’s managers believe that the mileage guarantee offered with the tire will be an important factor in the acceptance of the product. Let X = miles that the tires last: X~N(60,000 2,500) Find the mileage guarantee that ensures this company will repair no more than 15% of its product for free. Assume the distribution of tire mileage is normal.The answer to each of the following questions will be one of the points labeled A-H on the scatterplot. (i) Of the sales that received lower-than-predicted tips, which one had the lowest sale amount? [ Select ] ["D", "E", "A", "B", "F", "H", "G", "C"] (ii) Which sale received the best tip, that is, which sale had the tip that was highest above the tip predicted for it? [ Select ] ["A", "B", "D", "E", "C", "G", "H", "F"] (iii) Which data point has the smallest residual? [ Select ] ["A", "C", "F", "H", "D", "G", "B", "E"] (iv) Of E and F, the model makes a better prediction for [ Select ] ["E", "F"] .


