Table 3: Frequency distribution of Hwy MPG Cumulative relative frequency Relative Hwy MPG Tally Frequency frequency 15 – 20 20 – 25 25 – 30 30 – 35 35 – 40 i. What proportion of vehicles have mileage between 20 and 30 MPG What proportion of vehicles have mileage of at least 30 MPG Construct a histogram to display the data represented in table 3. ii. iii.
Table 3: Frequency distribution of Hwy MPG Cumulative relative frequency Relative Hwy MPG Tally Frequency frequency 15 – 20 20 – 25 25 – 30 30 – 35 35 – 40 i. What proportion of vehicles have mileage between 20 and 30 MPG What proportion of vehicles have mileage of at least 30 MPG Construct a histogram to display the data represented in table 3. ii. iii.

MATLAB: An Introduction with Applications
6th Edition
ISBN:9781119256830
Author:Amos Gilat
Publisher:Amos Gilat
Chapter1: Starting With Matlab
Section: Chapter Questions
Problem 1P

Related questions
Question
need the sollve correctly plz
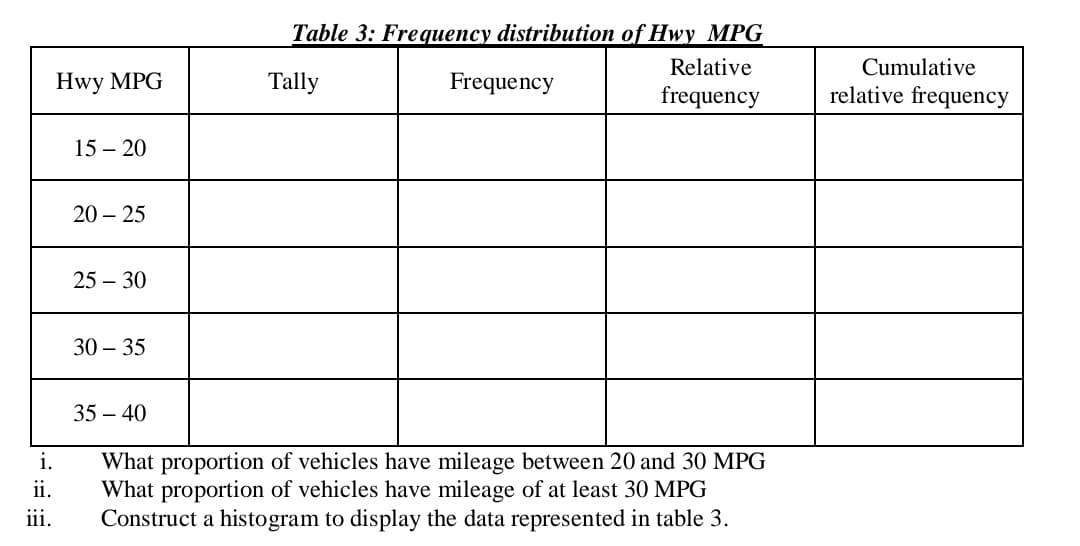
Transcribed Image Text:Table 3: Frequency distribution of Hwy MPG
Relative
Cumulative
Hwy MPG
Tally
Frequency
frequency
relative frequency
15 – 20
20 – 25
25 – 30
30 – 35
35 – 40
i.
What proportion of vehicles have mileage between 20 and 30 MPG
What proportion of vehicles have mileage of at least 30 MPG
Construct a histogram to display the data represented in table 3.
ii.
iii.
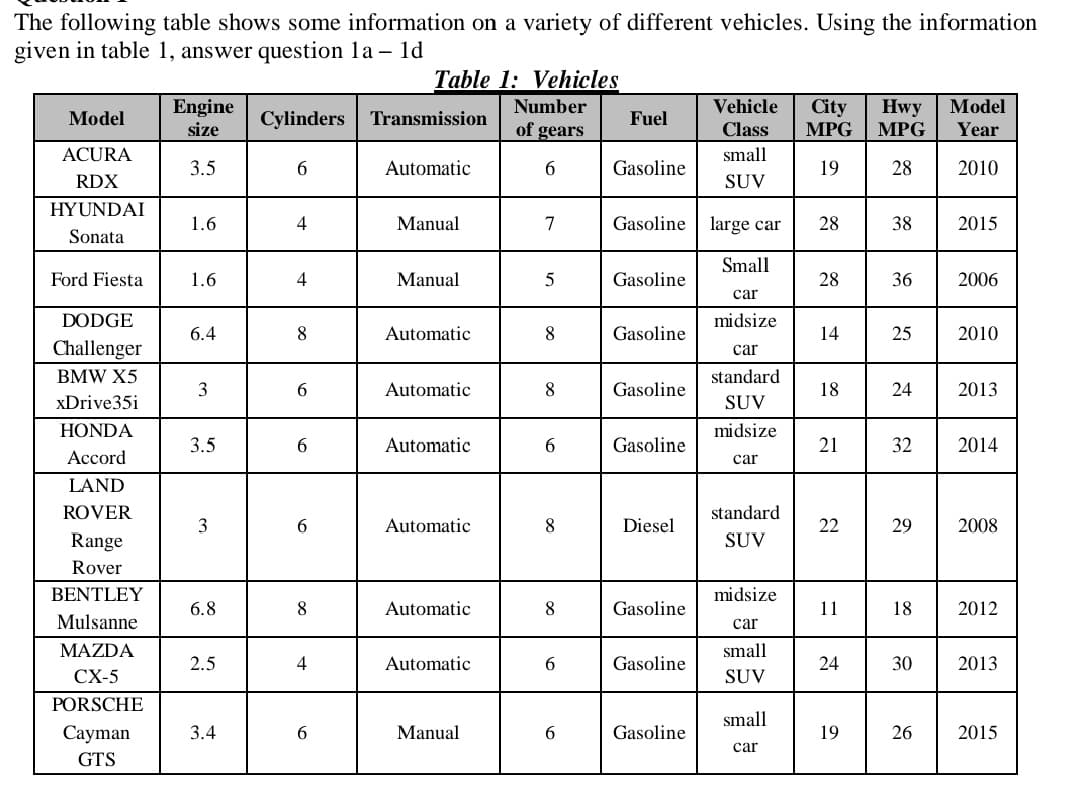
Transcribed Image Text:The following table shows some information on a variety of different vehicles. Using the information
given in table 1, answer question la – 1d
Table 1: Vehicles
Model
Year
Number
Engine
size
Hwy
MPG
Vehicle
City
MPG
Model
Cylinders
Transmission
Fuel
of gears
Class
ACURA
small
3.5
6.
Automatic
Gasoline
19
28
2010
RDX
SUV
HYUNDAI
1.6
Manual
7
Gasoline
large car
28
38
2015
Sonata
Small
Ford Fiesta
1.6
4
Manual
5
Gasoline
28
36
2006
car
DODGE
midsize
6.4
8
Automatic
8
Gasoline
14
25
2010
Challenger
car
BMW X5
standard
3
6.
Automatic
8
Gasoline
18
24
2013
xDrive35i
SUV
HONDA
midsize
3.5
6.
Automatic
6.
Gasoline
21
32
2014
Асcord
car
LAND
ROVER
standard
3
6.
Automatic
8
Diesel
22
29
2008
Range
SUV
Rover
BENTLEY
midsize
6.8
8
Automatic
8
Gasoline
11
18
2012
Mulsanne
car
MAZDA
small
2.5
4
Automatic
6.
Gasoline
24
30
2013
CX-5
SUV
PORSCHE
small
Cayman
3.4
Manual
6.
Gasoline
26
2015
car
GTS
Expert Solution
This question has been solved!
Explore an expertly crafted, step-by-step solution for a thorough understanding of key concepts.

This is a popular solution!

Trending now
This is a popular solution!

Step by step
Solved in 2 steps with 1 images

Recommended textbooks for you
MATLAB: An Introduction with Applications
Statistics
ISBN:
9781119256830
Author:
Amos Gilat
Publisher:
John Wiley & Sons Inc

Probability and Statistics for Engineering and th…
Statistics
ISBN:
9781305251809
Author:
Jay L. Devore
Publisher:
Cengage Learning

Statistics for The Behavioral Sciences (MindTap C…
Statistics
ISBN:
9781305504912
Author:
Frederick J Gravetter, Larry B. Wallnau
Publisher:
Cengage Learning
MATLAB: An Introduction with Applications
Statistics
ISBN:
9781119256830
Author:
Amos Gilat
Publisher:
John Wiley & Sons Inc
Probability and Statistics for Engineering and th…
Statistics
ISBN:
9781305251809
Author:
Jay L. Devore
Publisher:
Cengage Learning
Statistics for The Behavioral Sciences (MindTap C…
Statistics
ISBN:
9781305504912
Author:
Frederick J Gravetter, Larry B. Wallnau
Publisher:
Cengage Learning

Elementary Statistics: Picturing the World (7th E…
Statistics
ISBN:
9780134683416
Author:
Ron Larson, Betsy Farber
Publisher:
PEARSON

The Basic Practice of Statistics
Statistics
ISBN:
9781319042578
Author:
David S. Moore, William I. Notz, Michael A. Fligner
Publisher:
W. H. Freeman

Introduction to the Practice of Statistics
Statistics
ISBN:
9781319013387
Author:
David S. Moore, George P. McCabe, Bruce A. Craig
Publisher:
W. H. Freeman