Q2: Assuming the mean of the fol Class midpoint frequency x+4 10 x+4 15 3x+8 20 2x-4
Q: From the following data compute the value of harmonic mean: Class interval 10-20 20-30 30-40 40-50…
A:
Q: .2 What is the sum of the x values for which the function f(x) = 3x² takes the average value in the…
A:
Q: Find the mean value of y = x + x° + x° over the range 0 < x < 2. Enter your answer as a decimal in…
A:
Q: From the following data compute the value of harmonic mean: Class interval 10-20 20-30 30-40 40-50…
A: Given data is Class Interval Frequency 10 - 20 4 20 - 30 6 30 - 40 10 40 - 50 7 50 - 60…
Q: Suppose f"(x) = N, (h) + a,h + a,h² + azh³ + . The value of N2(h) using Richardson's extrapolation…
A: Solution- Given, Using Richardson's Extrapolation, let us assume, , where is an unknown constant…
Q: (b) Compute P(x < 25). (c) Compute P(23 < x < 25). (d) Compute E(x). (e) Compute Var(x). (Round your…
A: Note: Hey, since there are multiple subparts posted, we will answer first three subparts. If you…
Q: Using Table G, find the P-value interval for the x test value. X= 2.809, n = 12, left-tailed O 0.005…
A: The test statistic value is 2.809 and the sample size is 12.
Q: The value of c that satisfy the conclusion of the Mean Value Theorem for f(x) = x in the interval 0,…
A: We have to check
Q: Suppose X ~ Bernoulli(0.5), Y ~ Bernoulli(0.1), independent. What is Var(X*Y)?
A: We have given that X ~ Bernoulli(0.5), Y ~ Bernoulli(0.1)The variance of Bernoulli distribution is…
Q: con to view the t-distribution table. Je(s) is/are
A: As given n = 25 α = 0.1 The test is right tail test.
Q: Use the following graphs to estimate f (g(-2)). 3 f(x) g(x) -3 3 -3 -3 -3 Round your answer to one…
A: To evaluate , fg-2
Q: O Determine average rates Of change on f(x) or the interval [l,4] nearest tenth.otN SunoVY eN ]- uf…
A:
Q: Let f(x) = x/r +8. Answer the following questions. 1. Find the average slope of the function f on…
A: Given function is, fx=xx+8
Q: If h (x) = 4x² – 15x – 9 on the interval [-1, 3]: Apply the mean value theorem to find the value of…
A: We can use the mean value theorem in order to solve the given problem.
Q: For a given table 1 3 6. 10 f (x) 4 7 11 15 Using linear interpolation formula, find f (5).
A: The linear interpolation formula is given by y=y1+(x-x1)y2-y1x2-x1 where, x1,y1 and (x2,y2) be two…
Q: Given that, S(C) = 2sin( 3t) %3D Find the mean value of f(t) in the interval 0 <t < 5, correct to…
A:
Q: Let f(x) = xVx + 5. Answer the following questions. 1. Find the average slope of the function f on…
A: Given, f(x)=xx+5
Q: Let f(x) = xvx +6. Answer the following questions. 1. Find the average slope of the function f on…
A: Given function is f(x)=xx+6 Differentiate with respect to x.…
Q: A magazine provided results from a poll of 1000 adults who were asked to identify their favorite…
A: From the provided information, Among 1000 respondents 13% choose chocolate pie and the margin of…
Q: or a normal distibution the z value for r 00 x value B to Lett an x Cf the mean n is equal to zro…
A: A z-score indicates how many standard deviations a data point is above or below the mean. Z-scores…
Q: f the computed interval estimate for μX−μY contains positive values only then we are highly…
A:
Q: 7
A:
Q: The upper whisker of a box plot is equal to the smallest observation that is within the upper limit…
A: The upper whisker of a box plot is largest value that is no greater than ( Q3 +1.5*IQR) True
Q: Compute the control limits (CL, UCL and LCL) of an -R chart from the following quantities. Number of…
A:
Q: Suppose X is time to take a portion of the SAT test and f(x) = x/8 from 0 to 4 hours. Find the mean…
A: The formula to obtain the value of mean is ,
Q: Let f(x)=10-3x². Find the average rate of change of f(x) on each of the following intervals. (S…
A: Function
Q: Graph the function f(x)=-5x^2-6 On [0,4] And find the average value over the interval
A: We have to find average value
Q: From the following data compute the value of harmonic mean: Class interval 10-20 20-30 30-40 40-50…
A: Given: Class interval 10-20 20-30 30-40 40-50 50-60 Frequency 4 6 10 7 3
Q: d. Develop a 95% prediction interval for y when æ = 8 (to 2 decimals).
A: R code: library(readxl)df <- read_excel("C:/Users/ragha/Desktop/df.xlsx") model = lm(y~x,…
Q: 1. Complete the table and use the information on it to compute the mean. Class Class Class Frequency…
A: Hey there.! thank you for posting your question. Hope you’re doing well. Since you have posted…
Q: Q2/| By Simpson's rule, find the value of (In) approximatally, dividing the range into (10) equal…
A:
Q: From the values of the factors given below, find thẹ corrected values of the first four Moments…
A: Moments are used to represent the probability mass function of data distribution. The first moment…
Q: A sample of 10 cartons of Arrow water was taken to measure the degree of salts in the water and the…
A: Given data is appropriate for measures of central to find the mean and the measures of dispersion.
Q: Complete the table Class limit Class Midpoint fx fx? (x) 15-19 10-14 15 5-9 13 0-4 7 Using the…
A:
Q: The graph of y = f(x) is given below. 2 -2- (a) What is f(x)dx? (b) What is the average value of f…
A: ⁸
Q: Give the value of c in the interval [-1, 2] that satisfies the conclusion of the mean value theorem…
A:
Q: 4. Suppose that a ball has height h(t) = -4.9t2 + 10t +1 meters after t seconds. Suppose that the…
A: An object thrown up or down falling under the gravity is describes as projectile motion, and object…
Q: A manufacturer makes thousands of ballpoint pens per day, and estimates that 3% are defective and…
A: Given : A manufacturer makes thousands of ballpoint pens per day, and estimates that 3% are…
Q: Explain the concept of linear interpolation. Using linear interpolation, find (3) for f(x) - 5*.…
A: It is given that fx=5x. We have to find the interpolation polynomial using the given function. We…
Q: For f '(x), what is the intervals of concavity and for f(x)= x°5-3x^4+l5? Find ANY inflection points…
A:
Q: In the following problems, find the mean value of the given function over the specified region R.…
A: INTRODUCTION: Numbers in the provided data set are represented by their average value. It is a…
Q: 3. Given the following p.d.f.: f(x) = 3e-3x, where x > 0, find the Median. Show all work and…
A: Given, p.d.f is fx=3e-3x, x>0 Note: ∫0mfxdx=12 m is the median of x.
Q: are defined c chy's mean
A:
Q: 2. The probability in minutes of being waited on in a large chain restaurant is given by the…
A:
Q: Which of the following statement is FALSE about X? ANOVA Source of variation df MS F stat P-value F…
A: General ANOVA table is, Source of Variation df Sum of squares Mean square F…
Q: 9. The mean value of a function f(x) from a to b is given by
A:
Q: Suppose f"(x) = N¿(h) + a,h + azh² + azh³ + -· The value of N½(h) using Richardson's extrapolation…
A: As per the company policy i can answer only first question for you,more than that leads me towards…
Q: From the following data calculate Harmonic mean Class Interval Frequency 0-10 20 10-20 25 20-30 85…
A:
Q: Suppose the midclass point X, and frequency f, in a frequency table satisfy the following 5. ΣΧ-150…
A: The mean is, Mean=∑xifi∑fi=29110=29.1 Thus, the mean is 29.1.
Q: From an F-table or using Excel, you can infer that the p-value is O Less than 0.01 Between 0.01 and…
A: Step by step procedure to ANOVA table using EXCEL: In Excel sheet, enter Porsche, Mercedes and BMW…
how i can solve this please
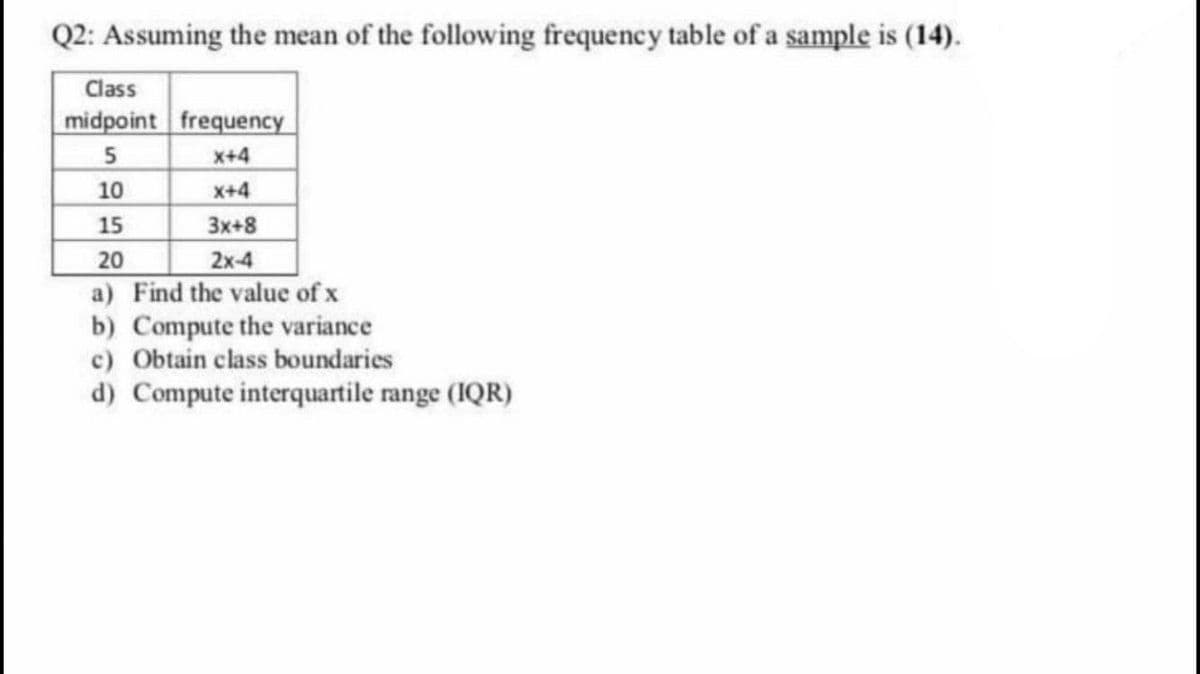
Step by step
Solved in 5 steps
- Recent surveys have shown a decline in the percentage of U.S. households withcable TV. In one city, a simple random sample of 468 households had 117households reporting they had cable TV, and 351 households reporting they didnot.(a) Show the “plug-in” box to represent our best guess for the relative frequency ofpeople with and without cable. (Let 1 correspond to with cable and 0 without).(b) The percentage of households in the city with cable TV is estimated to be___________%, and this estimate is likely to be off by about ___________% or so.(c) A 90%-confidence interval for the percentage of households in the city withcable TV goes from ___________% to ___________%.Based on a Pitney Bowes survey, assume that 42% of consumers are comfortable having dronesdeliver their purchases. Five consumers are randomly selected from the population that wassurveyed. d) Use the range rule of thumb to determine if 4 of the 5 consumers being comfortable withdrone deliveries is significantly high.The Weight and Blood Pressure of 26 Randomly Selected Male People in a Group ages 25 to 30 are shown in the following table. Suppose weight and blood pressure are normally and jointly distributed Y= 69.1044 + 0.4194x A)Test the hypothesis that rho = 0 and test the hypothesis that rho = 0.6
- The table below summarizes data from a survey of a sample of women. Using a 0.01significance level, and assuming that the sample sizes of 800 men and 300 women are predetermined, test the claim that the proportions of agree/disagree responses are the same for subjects interviewed by men and the subjects interviewed by women. Does it appear that the gender of the interviewer affected the responses of women? Gender of Interviewer Man Woman Women who agree 498 247 Women who disagree 302 53 Compute the test statistic, rounding to three decimal places. Find the critical value(s). (Round to three decimal places) What is the conclusion based on the hypothesis test?The assumption of homogeneity of variances was tested by Levene’s Test, F(2, 432) = .75, p = .48. Was the assumption met?A sample of thirty people is obtained and each person taste three brands of instant coffee and identifies his or her preference. The resulting observed frequency data are as follows: Brand X Brand Y Brand Z 5 14 11 1 A researcher wants to use these data to test for preferences among the three brands. State the hypotheses and find the expected frequencies for the chi-square test if the researcher expects an equal proportion to fall within each group. 2 Consumer data show that ten years ago, “Brand X” was preferred by 20% of the population, “Brand Y” was preferred by 40% of the population, and “Brand Z” was preferred by 40% of the population. A researcher wants to use these data to test whether there has been a significant change in preferences during the past ten years. State the hypotheses and find the expected frequencies for this chi-square test. 3 Compute two goodness-of-fit hypothesis tests—first using the expected frequencies from part a, and then using the…
- Suppose you randomly select a sample of 16 observations from a population with �=11 attached in ss below thanks for help agoajgr rA two-factor, independent-samples design is evaluated using an analysis of variance. The F-ratio for factor A has df = (2, 99) and the F-ratio for factor B has df = (2, 99). Based on this information, the degrees of freedom for A x B interaction would be df = (censored, ____________). Fill in the blank for the second value.The claim is that the proportion of accidental deaths of the elderly attribute to residential falls is more than 0.15, and the sample statistics include n=600 deaths of the elderly with 102 of them attributable to residential falls. Find z.
- Suppose that a random sample of size 1 is to be taken from a finite population of size N. a. How many possible samples are there?b. Identify the relationship between the possible sample means and the possible observations of the variable under consideration.c. What is the difference between taking a random sample of size 1 from a population and selecting a member at random from the population?Use the data in Ex 9.17, but pretend that the sample sizes were 50 and 50.Do the data provide significant evidence, at the 3% level, that the population mean recall for the video-only group is higher than the population mean recall for the A/V group?(zobs =0.973, z.03 =1.88 )