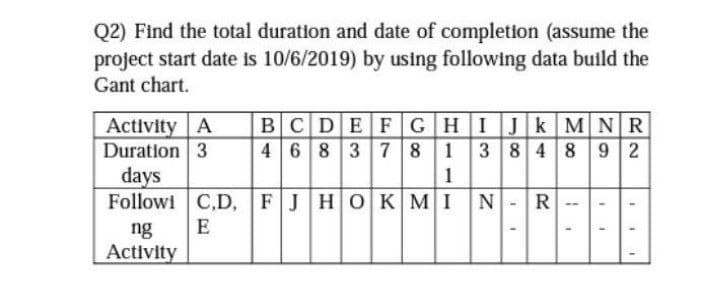
Q2) Find the total duration and date of completion (assume the project start date is 10/6/2019) by using following data build the Gant chart. Activity A Duration 3 days Followi C,D, FJHOK MI BCDEFGHIJK MNR 468 3 7 8 1 38 4 8 9 2 1 N-R E ng Activity


Q: hich data would be sultable for a ple chart? Multiple Cholce Whiripool Corporation's sales revenue…
A: Here we want to know data suitable for a pie chart.
Q: The following graph represents: 15 12 11 10 39 44 49 54 59 64 69 74 O Categorical data O Continuous…
A: Discrete data are the data which give certain value. Example: number of students present in the…
Q: A pediatrician wants to determine the relation that exists between a child's height, x, and head…
A: 1. Find Regression line equations from the following data X Y 28 17.6 24.75 17.2 25.75 17.2…
Q: A scatter diagram is a visual method used to display a relationship between two ______ variables.…
A: Solution: A relationship between two interval-ratio variables in which displayed in a scatter…
Q: SAS/Graph Gchart Bar Chart Jll. 11 12 13 14 15 16 Age 3.8 4 12 13 13.3 13.5 The mean age is The mode…
A: Given; n = 19 Formula used: Mean = 1n∑i=1nXi Formula of median when, n is odd Median = n+12thterm…
Q: The time of arrival of an artificial seismic wave versus the distance from the source is given in…
A: Given: Distance (m) Time (sec) 530 0.349 600 0.391 670 0.441 1130 0.739 1200 0.787…
Q: Use MINITAB or some other computer software toconstruct a stem-and-leaf display for the following…
A: The stem and leaf plot is obtained using EXCEL MegaStat. The software procedure is given below:…
Q: The following table gives information on the average saturated fat (in grams) consumed per day and…
A: (c ) Use EXCEL to construct the scatter plot. EXCEL procedure: Go to EXCEL Go to Insert menu…
Q: Use a graphing utility to find the line of best fit for the following data. y 9. 13 12 15 17 20 The…
A:
Q: 7. A mid-priced chain of hotels, Hometown Suites, strives to make its guests "feel at home" by D B…
A: Since you have asked multiple questions, we will solve the first question for you. If you want any…
Q: 15. Determine the 5 number summary for this data set of tire pressures(psi). 88 7 36 88 42 18 37…
A: Introduction :- For the given data we have to create 5 number summary. i.e Minimum Q1 Median Q3…
Q: The depths (in inches) at which 10 artifacts are found are listed. Complete parts (a) and (b) below.…
A:
Q: Use the nocompenying date set to cormplete the following actions. . Find the quertiles. b. Find the…
A: Given data is ,63,55,64,65,63,56,61,63,54,59,56,55,60,65,79Arrange the given data in ascending…
Q: The variation. curve describes are due to: a. Nonassignable causes b. Catastrophic failure c.…
A: We know that in general, the random things follow Normal distribution for e.g.-if you collect…
Q: 4. A person's commuting time from home to the workplace (X) and from the workplace to home (Y) is…
A: As per bartleby guidlines, for more than three subparts, first three needs to be solved and others…
Q: P= _____*_______+________
A:
Q: Construct an ogive that represents the following data regarding the students' scores on a recent…
A: Construction of give that represents the following data regarding the students' scores on a recent…
Q: The depths (in inches) at which 10 artifacts are found are listed. Complete parts (a) and (b) below.…
A: Solution
Q: D The food and Agncultus ural the Unifed Naflons, FA OSTAT, Collects information on the Production…
A: FAO of United Nations collects the information on consumption of Alcohol in gallons per year. A stem…
Q: Commute Times in Minutes Stem Leaves 6. 0 0 3 3 4 6 7 8 1 8 1 2 4 5 6 6 Key: minutes %3D 34
A: Given: The steam and leaf plot represents the commute times in minutes. The provided stem and leaf…
Q: During one shift, the express lane clerk recorded how many times customers violated the "10 items or…
A: The histogram shows the number of items over the limit each violator placed on the conveyor belt.
Q: Alcohol Consumption Mean SE None 3.49 0.20 Moderate 4.09 0.22 a. Construct a bar graph that…
A: Part a: Steps for constructing the bar graph 1. Draw an x-y plane. 2. Mark two points at a…
Q: D. 2011 2012 SliceA 45 20 2012 2011 SliceB 33 28 Slicec 22 21 100 50 3.641896 3.989423 219 1548564…
A: The given data is, The combined data of years 2011 and 2012 is,
Q: Determine whether the following examples are discrete or continuous data sets. Write "DISCRETE" for…
A: The number of errors would be fixed numbers for different students. They need not be connected to…
Q: Air tratfic controllers have the crucial task of ensuring that aircraft don't collide To do this,…
A:
Q: Classify each of the following as nominal, ordinal, interval, or ratio data. a. The time required…
A: In an interval variable we have a proportionate and equal interval between variables but do not have…
Q: Data Set I 41 44 45 47 47 48 51 53 58 66 Data Set II 20 37 48 48 49 50 53 61 64 70
A: Data can be raw or grouped, with some pros and cons associated with both of them. Raw data have each…
Q: 11) Determine the Interquartile Range of the set of data. Show all work.
A: Given data set:- 1,3,3,7,8,8,11,14,15,19,21,21,21 Ther are given 13 data points
Q: Data was collected for 40 randomly selected trees growing in the median strip of a busy freeway. The…
A: given that each class contains its lower class boundary , but not its upper class boundary. and…
Q: 4. Convert the following continuous data (male heights) into an ordinal scale. Male #: 2 3 4 5 6.…
A: male 1 2 3 4 5 6 height (cm) 181 202 190 185 190 200
Q: The table reports the number of weekly death according to age groups and their total for the past…
A:
Q: The depths (in inches) at which 10 artifacts are found are listed. Complete parts (a) and (b) below.…
A: The depths in inches are found as listed. We have to find the range of the data set.
Q: Identify whether the given is a discrete or continuous variable. 1.The weight of a box of cereal…
A: Solution-: Identify whether the given is a discrete or continuous variable. (1) The weight of a box…
Q: The basketball coach at a local college believes that his team scores more points at home games when…
A: Let Score be denoted as x. Let Attendance be denoted as y. Calculate the following values. x y…
Q: Group SEM Alcohol 25 0.25 0.05 Placebo 25 0.12 0.03
A: Given data: For the group Alcohol, n1=25x¯1=0.25SEM= 0.05 For the group Placebo, n2=25x¯2=0.12SEM=…
Q: During each shift he worked, a grocery lane clerk recorded violated the mask rule for his check-out…
A: The histogram corresponding frequencies is marked below.
Q: 18 16 14 12 frequency 10 8 4 2 IL III IV v VI height (classes) %D
A: Just by looking at a probability histogram, you can tell if it is normal by looking at its shape. If…
Q: (a) Use an appropriate computer program to fit aplane to the following data relating the monthly…
A: From given information, y = Monthly water usage, x1 = Production in tons, x2 = Mean ambient…
Q: The basketball coach at a local college believes that his team scores more points at home games when…
A: State the hypotheses. Use EXCEL to obtain the value correlation coefficient r: EXCEL procedure:…
Q: During one shift, the express lane clerk recorded how many times customers violated the "10 items or…
A: We have given that a histogram plotting no.of items over 10 i.e.violating '10 or less' rule against…
Q: The basketball coach at a local college believes that his team scores more points at home games when…
A: Since you have posted multiple sub-parts, we will solve the first three sub-parts for you. To get…
Q: on a flat, nat age group table, the median dista age group Is also Representative Age (Midpoint of…
A: Since you have posted multiple sub-parts, we will solve the first three sub-parts for you. To get…
Q: se the given minimum and maximum data entries, and the number of classes, to find the class width,…
A:
Q: 8. The Oceanography Club sold art calendars in order to raise moncy, he table lists the Humber of…
A: Given that:
Q: The depths (in inches) at which 10 artifacts are found are listed. Complete parts (a) and (b) be…
A: Given data : 25.5 41.5 35.9 38.8 45.3 36.7 23.1 31.2 36.6 30.79
Q: Use the given data set to complete parts (a) through (c) below. (Use a0.06.) 10 7.47 8. 13 6. 7.11…
A: Given : The following data is given below
Q: llustration 9.33. The following data represent travel expenses ( 'her than transportation) for 7…
A:
Q: The students in Ms. Yuri's class reported the number of hours they watched television last week.…
A:
Q: Given a data set with и 3D 18 аnd o — find the percent of data within each range: Just type the…
A: As per company guidelines I solved exactly three subparts of the question.thank you

Step by step
Solved in 2 steps with 2 images

- Samples are collected from the River X and pH values are observed. 9 different pH values arelisted in table 3.Table 3Concentrations 4.2 3.8 6.0 3.5 8.1 4.9 4.1 3.2 4.0Draw box plot and finda. Bowley’s coefficient of skewnessb. Karl Pearson’s coefficient of skewnessc. Third momentRubricStages of Process MarksImagine and Plan 2Composition 2Effort 1Find kurtosis by using ungroup data given in the picture using quartile deviation, make sure to arrange data before solving question.It is known that the tensile strength of a plastic increases as a function of the time it is subjected to heat treatment. The table below shows the data of the plastic subjected to heat treatment. Determine these data by using the "lagrange interpolation" method by approximating the functions of the lagrange multipliers of L0 , L1 , L2 , L3 and L4 to a 4th order curve. Calculate the tensile strengths of 1.7321 and 2.2361 seconds for each lagrange factor in the function equations of the lagrange multipliers.
- ONLY THE LAST ONE Consider the accompanying data on flexural strength (MPa) for concrete beams of a certain type. 5.9 7.2 7.3 6.3 8.1 6.8 7.0 7.5 6.8 6.5 7.0 6.3 7.9 9.0 8.4 8.7 7.8 9.7 7.4 7.7 9.7 8.2 7.7 11.6 11.3 11.8 10.7 The data below give accompanying strength observations for cylinders. 6.5 5.8 7.8 7.1 7.2 9.2 6.6 8.3 7.0 8.3 7.8 8.1 7.4 8.5 8.9 9.8 9.7 14.1 12.6 11.9 Prior to obtaining data, denote the beam strengths by X1, . . . , Xm and the cylinder strengths by Y1, . . . , Yn. Suppose that the Xi's constitute a random sample from a distribution with mean μ1 and standard deviation σ1 and that the Yi's form a random sample (independent of the Xi's) from another distribution with mean μ2 and standard deviation σ2. (a) Use rules of expected value to show that X − Y is an unbiased estimator of μ1 − μ2. E(X − Y) = E(X) − E(Y) = μ1 − μ2 E(X − Y) = E(X) − E(Y) 2 = μ1 − μ2 E(X − Y) = nm E(X) − E(Y) = μ1 − μ2 E(X −…To determine how climate change and habitat loss will influence Antarctic species, baseline estimates of population sizes and distributions are needed. To this end, a group of researchers estimated the population sizes of all breeding colonies of emperor penguins (Aptenodytes fosteri) along Antarctic coastlines using satellite imagery (Fretwell et al., 2012). For each breeding colony encountered, the researchers determined the latitude, longitude, and area (m2) of the colony, and estimated the total number of emperor penguins present. Then, they compared their colony size estimates to previously published estimates. Suppose the researchers want to determine if there is a linear relationship between the previous population estimates and the current population estimates, so they decide to conduct a two-tailed T test for no linear relationship. From 29 data points, they calculate the linear regression equation to be Y^ =925.25556+0.71001x where ?Y^ is the predicted current population…Calculateaconfidenceinterval for the me-dian ofthe second population.Select your confidenc eleve land reportit with your answer.??
- The specification for the pull strength of a wire that connects an integrated circuit to its frame is 10 g or more. Units made with aluminum wire have a defect rate of 10%. A redesigned manufacturing process, involving the use of gold wire, is being investigated. The goal is to reduce the rate of defects to 5% or less. Out of the first 100 units manufactured with gold wire, only 4 are defective. True or false: a) Since only 4% of the 100 units were defective, we can conclude that the goal has been reached. b) Although the sample percentage is under 5%, this may represent sampling variation, so the goal may not yet be reached. c) There is no use in testing the new process, because no matter what the result is, it could just be due to sampling variation. d) If we sample a large enough number of units, and if the percentage of defective units is far enough below 5%, then it is reasonable to conclude that the goal has been reached.(a) Calculate a 95% two-sided CI for the true average bond strength. (b) Calculate a 95% two-sided CI for the proportion of all such bonds whosestrength values would exceed 10. show major intermediate steps.Test the hypothesis that the average weekly allowance of female and male ACC 215 students the same, at 5%l evel of significance. Weekly Allowance of Students (Php) Male: 1500 2000 2500 2500 2000 1750 2000 1800 Female:1500 2000 1750 1500 2000 2500 3000 3500 Ho: Ha: α = Decision Rule: Computation: Decision: Conclusion:
- A researcher hypothesizes that electrical stimulation of the lateral habenula will resultin a decrease in food intake (in this case, chocolate chips) in rats. Rats undergostereotaxic surgery and an electrode is implanted in the right lateral habenula. Followinga ten day recovery period, rats (kept at 80 percent body weight) are tested for thenumber of chocolate chips consumed during a 10 minute period of time both with andwithout electrical stimulation. The testing conditions are counter balanced. Compute theappropriate t-test for the data provided below.Stimulation No Stimulation12 87 73 411 148 65 714 127 59 510 8What probability level did you choose and why?What were your degrees of freedom?Is there a significant difference between the two testing conditions?Interpret your answer.If you have made an error, would it be a Type I or a Type II error? Explain youranswer.A researcher hypothesizes that electrical stimulation of the lateral habenula will resultin a decrease in food intake (in this case, chocolate chips) in rats. Rats undergostereotaxic surgery and an electrode is implanted in the right lateral habenula. Followinga ten day recovery period, rats (kept at 80 percent body weight) are tested for thenumber of chocolate chips consumed during a 10 minute period of time both with andwithout electrical stimulation. The testing conditions are counter balanced. Compute theappropriate t-test for the data provided below.Stimulation No Stimulation12 87 73 411 148 65 714 127 59 510 81. What is your computed answer?2. What would be the null hypothesis in this study?3. What would be the alternate hypothesis?4. What probability level did you choose and why?5. What were your degrees of freedom?6. Is there a significant difference between the two testing conditions?7. Interpret your answer.8. If you have made an error, would it be a Type I or a Type II…A tax accountant would like to test the claim that the proportion of individuals who owe when filing their taxes is less than 0.20. If the z− test statistic was calculated as z=−2.11, does the tax accountant have enough evidence to reject the null hypothesis? Assume α=0.005. Move the blue dot to choose the appropriate test (left-, right, or two-tailed). Then, use the graph below to show the test statistic, p-value, and the rejection region to make a conclusion about the hypothesis test. powered by Move the blue dot to choose the appropriate test α=0.01 α=0.025 α=0.05 α=0.1 Significance level = 0.01 Select the correct answer below: There is enough evidence to suggest the proportion of individuals who owe when filing their taxes is less than 0.20. There is not enough evidence to suggest the proportion of individuals who owe when filing their taxes is less than 0.20. There is enough evidence to suggest the proportion of individuals who owe when filing their taxes is greater than 0.20.…
