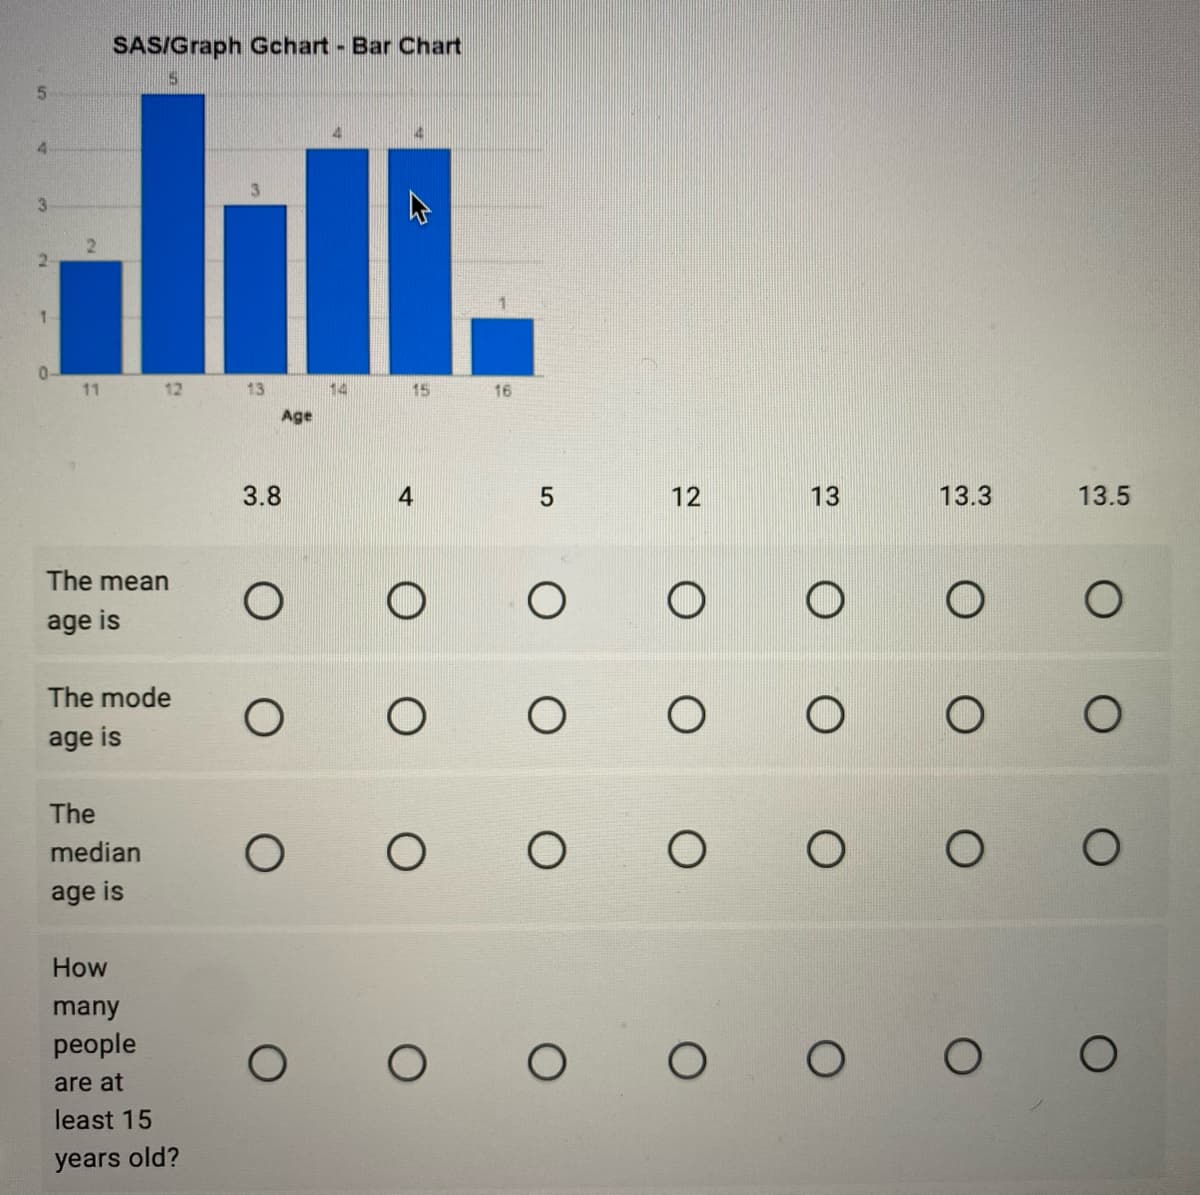
SAS/Graph Gchart Bar Chart Jll. 11 12 13 14 15 16 Age 3.8 4 12 13 13.3 13.5 The mean age is The mode age is The median age is How many people are at least 15 years old?
Q: 110 100 90 16 80 70 14 60 12 50 10 40 30 8 20 10 September January February March April 1 to 7 18 to…
A: Given information:- The decrease and increase in the population can calculated by determine the…
Q: How would I gragh this problem
A: Hello there! according to our principles can answer only one question at a time. Kindly find the…
Q: The given data represent the number of people from a town, aged 25-64, who subscribe to a certain…
A: Age People 25-34 502 35-44 827 45-54 230 55-64 85
Q: Q2) Draw a Histogram & Frequency Polygon for the given data. Class 10 – 19 20 - 29 30 - 39 40 - 49…
A: Given : Class Intervals Frequency 11-19 7 20-29 13 30-39 22 40-49 11 50-59 6 60-69…
Q: You work at a bank and are asked to recommend the amount of cash to put in an ATM each day. You…
A: The histogram for given data is
Q: ) Make a frequency diagram with 7 classes b) Make a histogram c) Give the five-number…
A: As per our guidelines, we are allowed to answer first three sub-parts only. Thanks DATA: 20 25 40…
Q: Prepare a frequency Histogram and Polygon from the data in the frequency distribution below…
A: Frequency histogram:
Q: 1. The data betsu represents the heights (cm) of 20 beys 140 138 133 148 160 153 131 146 134 136 149…
A: (i) Make a table to list the classes and frequency of data set.
Q: se he. 3 12. 7ollowing figures give the ages in years of newly married husbands and wives Represent…
A:
Q: + 10 12 13 14 data 11 15 16 17 18 Based on the boxplot above, what is the value for the median
A: The objective is to find the value of median based on the box plot.
Q: Question 13 C0/1 pt 55 The following refer to the following data set: 90.6 104.1 74.3 95.8 84.2 86.6…
A: The following is the given data set: 90.6 104.1 74.3 95.8 84.2 86.6 98.8 110.2 110.2 110.2…
Q: Consider the following histogram. Frequency 8. 64 2- 500 700 900 1100 1300 1500 Completion time (in…
A: Hi! Thank you for the question, As per the honor code, we are allowed to answer three sub-parts at a…
Q: me data below represent the age (in years) for 30 randomly selected students on campus this quarter.…
A: As per guidelines we will solve the first question only, please repost other questions for more…
Q: Course: (MA-219 and MA-03) Biostatistics Institute of Biological Sciences Semester: 5th Assignment…
A: Given, CI Frequency 10-19 7 20-29 13 30-39 22 40-49 11 50-59 6 60-69 5 The table…
Q: PRINTER VERSION 1 BACK Chapter 2, Section 1, Exercise 010 In this exercise, data from the…
A: Solution: From the given information, Then, the relative frequency can be calculated by using the…
Q: Can you help me? This is the complete question. (This is not graded but, rather, an exercise to…
A: Step by step procedure to draw frequency polygon using EXCEL is shown below: Enter data in Excel…
Q: A) Which one of the following statistics is NOT an example of discrete data? Households watching…
A: Given data is appropriate for measures of central tendency . Discrete data is information that can…
Q: Suppose a survey of adults and teens (ages 12-17) in a certain country was conducted to determine…
A: “Since you have posted a question with multiple sub-parts, we will solve first three subparts for…
Q: 2.31 The median income for a four-person family has been reported as shown here for 1993–2003.…
A: We are given the median income of four persons family from the year 1993 to 2003 .…
Q: Table 13. Question No.2 A seller should know the proper etiquette in selling. Likert Scale Frequency…
A: Dear , student as per guidelines we can solve only 1st question plz upload again remaining parts…
Q: You take a random sample of 50 people and record their body weight in kilograms. Surprisingly, there…
A: Given that You take a random sample of 50 people and record their body weight in kilograms.…
Q: Answer the following questions base on what is being asked. 1. The table below shows the number of…
A: Hi! Thank you for the question, As per the honor code, we are allowed to answer one question at a…
Q: Here is a set of data. 43 44 125 173 491 546 551 589 869 875 914 971 985 995 Identify the 5 number…
A:
Q: Q No.1) a) Draw multiple bar chart to show the birth rates and death rates per thousand of five…
A: Bar charts are easier to make and easier to understand.
Q: QUESTION 1 The data below shows the number of laptops sold by 15 sales agents during the last…
A: The solution is as follows,
Q: 2.23 Matching Match each description with the correct histogram. 1. Heights of students in a large…
A: The objective is to identify the appropriate choice of the histogram for each of the given…
Q: Question 7 3 pts The following frequency distribution represents the number of texts sent in an hour…
A:
Q: 4. The table shows the number of AlIDS diagnoses by age at time of diagnosis in 2011. a. Make a…
A: The circle graph is as follow
Q: 2 3 4 5 6 7 8 9 10 11 12 13 14 15 16 17 18 19 20 Question 10 of 20 Moving to another question…
A: Given : Fifty-one (51) statistics students were asked how much sleep they get per school night…
Q: 2) A researcher is interested in studying if male smokers and female smokers smoke a different…
A: The test statistic in a research study is examined in this section information that is being used to…
Q: 14) The graph below is an example of a(n). Chart Title Chart Area 50 40 30 20 20 a) scatter plote b)…
A: A Ogive graph provides the representation of cumulative frequencies for the X values . The…
Q: The lengths in inches of 2020 new babies born in one week at a local hospital were recorded. 14.5…
A: Given the data 14.5, 15.5, 15.8, 16.8, 16.9, 18.0, 18.6, 18.9, 19.6, 19.8, 20.0, 20.3, 20.3, 21.1,…
Q: Q.1:The weights of 40 male students of a university are given in the following frequency table. Find…
A: Q1: The weights of 40 male students of a university are given in the following frequency table. We…
Q: 1. Draw a frequency polygon corresponding to the ogive curve given below. 100 90 80 70 60 50 40 30…
A: Ogive is a type of frequency polygon shows cumulative frequencies. From the given ogive we build the…
Q: The table below shows the monthly incomes (in thousands) of Mr. Adam. 11 56 | 43 21 11 12 11 10 | 48…
A: Since you have posted a question with multiple subparts, we will solve first three subparts for you.…
Q: 6) Commercial dredging can recover bronze age relics. Bronze age spearheads in Ireland gave the…
A: 6. Given: Data on Bronze age spearheads. Step-by-step procedure to draw the Pie chart using Excel:…
Q: Find a quadratic mean for the :following data Class Frequency Intervals 2.30-2.39
A: The quadratic mean is also called as root mean square. This is one of the types of average, based on…
Q: 55 30 50 15 2 Speed of Highway Drivers 60 50 40 30 20 10 50 55 60 65 70 75 80 85 Speed (in mph) a.…
A: The graph of number of drivers against speed is given.
Q: Suppose a magazine would like to investigate the relationship between the battery life, in hours,…
A: Since you have posted a question with multiple sub-parts, we will solve first three sub- parts for…
Q: A veterinarian is interested in the life span of golden retrievers. She recorded the age at death…
A: Hence mean = 10
Q: The following cumulative frequency curve shows the distribution of speeds of 60 cars. 60 Cumulative…
A: From the given information, Consider, Sample size (N) = 60 .In other words, total frequency =60…
Q: Descriptive Statistics.For the given data:4 8 18 20 21 22 23 24 25 26 27 28 29 30 30 31 31 32 32 33…
A: a. The given data is arranged in an ascending order. It can be seen that the minimum value is 4, and…
Q: The following cumulative frequency curve shows the distribution of speeds of 60 cars. 60 Cumulative…
A: From the given information, Consider, The total cars (CF) = 60, Thus,
Q: a) Define the type of the data b) Create the frequency, relative frequency table, and a histogram…
A: NOTE: Since there are multiple subparts we have solved the first three subparts for you. To get the…
Q: A stem and leaf diagram is used to: A) show the joint relationship between two variables. B) graph…
A: A stem and leaf plot, or stem plot, is a technique used to classify either discrete or continuous…
Q: uTube G E Create EStream You... Left:1:15:25 Tahani Alala: Attempt 1 In a Pyramid lake, people go to…
A: Given: d=0.37sd=0.47nd=7α=0.01
Q: Exercise 8. A table of some of the relative frequencies computed from a data set is?x 1…
A: Obtain the missing number in the given relative frequency distribution table:Relative frequency:The…
Q: (a) Draw a frequency bar chart for the data.(Hypothetical) (b) Find, (i) the mode, (ii) the median.…
A: answer:
Q: Which of the following graphic representation contains all original data entries? a box-plot a bar…
A: Box plot contains a five number summary, bar graph and line graph contains frequencies, pie chart…
Step by step
Solved in 5 steps
- Find the positive geometric mean between 4 and 64.A poll asked adults which activities they had engaged in during the past month. The results are listed below. Is it reasonable to conclude that 60.8% of those polled had seen a movie or gone to a sporting event during the past month? A. No, because these categories overlap. B. No, because the percentages in relative frequencies tables can never be added. C. Yes, because the percentages can always be added in relative frequency tables. D. Yes, because these categories do not overlap. E. No, because the poll is not based on a large enough number of individuals.The question of whether Friday the 13th is an unusually unlucky day or whether this idea is just superstition was evaluated. Researchers in the United Kingdom examined the relation between (a) numbers of traffic accidents on past Friday the 13ths versus (b) numbers of accidents occurring onFriday the 6ths (all between July 1990 and November 1992).Friday the 6th Friday the 13th139,246 138,548134,012 132,908137,055 136,018133,732 131,843123,552 121,641121,139 118,723128,293 125,532124,631 120,249124,609 122,770117,584 117,263 What is the sample size? Select a statistical procedure for this scenario. Correlation, paired sample t-test, or two sample t-test
- The question of whether Friday the 13th is an unusually unlucky day or whether this idea is justsuperstition was evaluated. Researchers in the United Kingdom examined the relation between (a)numbers of traffic accidents on past Friday the 13ths versus (b) numbers of accidents occurring onFriday the 6ths. (all between July 1990 and November 1992).Friday the 6th Friday the 13th139,246 138,548134,012 132,908137,055 136,018133,732 131,843123,552 121,641121,139 118,723128,293 125,532124,631 120,249124,609 122,770117,584 117,263 Indicate the null hypothesis and the alternative hypothesis and state your understanding what the hypotheses mean.The question of whether Friday the 13th is an unusually unlucky day or whether this idea is justsuperstition was evaluated. Researchers in the United Kingdom examined the relation between (a)numbers of traffic accidents on past Friday the 13ths versus (b) numbers of accidents occurring onFriday the 6ths. (all between July 1990 and November 1992).Friday the 6th Friday the 13th139,246 138,548134,012 132,908137,055 136,018133,732 131,843123,552 121,641121,139 118,723128,293 125,532124,631 120,249124,609 122,770117,584 117,263 Indicate the null hypothesis and the alternative hypothesis and state your understanding what the hypotheses mean. ( If you could make the handwritting readable that would be great)Calculate the relative frequency P(E) using the given information. Three hundred adults are polled, and 180 of them support universal health-care coverage. E is the event that an adult supports univer
- Calculate the relative frequency P(E) using the given information. Seven hundred adults are polled, and 490 of them support universal health-care coverage. E is the event that an adult supports universal health-care coverage. HINT [See Example 1.] P(E) =Florida State University has 14 statistics classes scheduled for its Summer 2013 term. One class has space available for 30 students, eight classes have space for 60 students, one class has space for 70 students, and four classes have space for 100 students. Find the mean of X (Round to 2 decimal places)The mean waiting time at the drive-through of a fast-food restaurant from the time an order is placed to the time the order is received is 87.6 seconds. A manager devises a new drive-through system that she believes will decrease wait time. As a test, she initiates the new system at her restaurant and measures the wait time for 10 randomly selected orders. The wait times are provided in the table to the right. Complete parts (a) and (b) below.