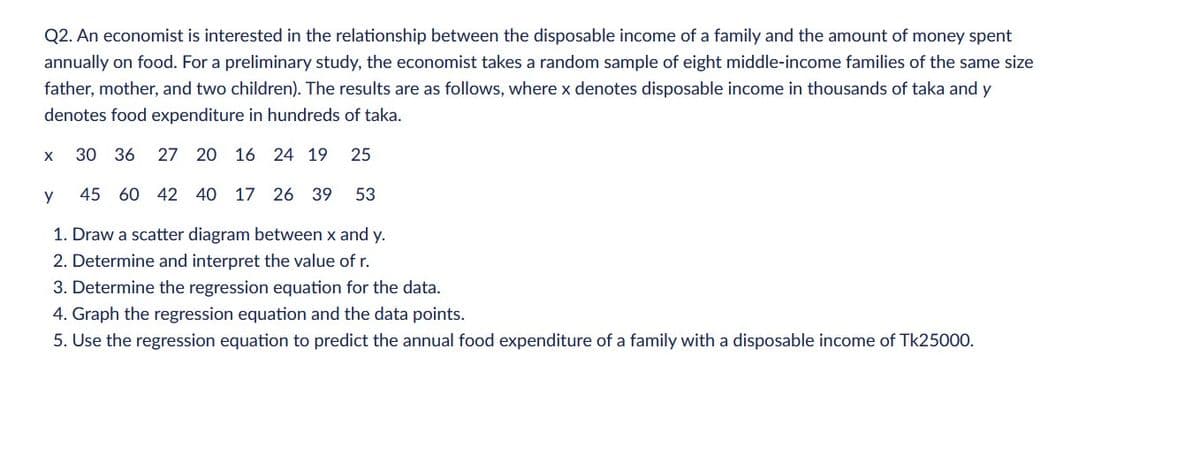
Q2. An economist is interested in the relationship between the disposable income of a family and the amount of money spent annually on food. For a preliminary study, the economist takes a random sample of eight middle-income families of the same size father, mother, and two children). The results are as follows, where x denotes disposable income in thousands of taka and y denotes food expenditure in hundreds of taka. X 30 36 27 20 16 24 19 25 y 45 60 42 40 17 26 39 53 1. Draw a scatter diagram between x and y. 2. Determine and interpret the value of r. 3. Determine the regression equation for the data. 4. Graph the regression equation and the data points. 5. Use the regression equation to predict the annual food expenditure of a family with a disposable income of Tk25000.
Q2. An economist is interested in the relationship between the disposable income of a family and the amount of money spent annually on food. For a preliminary study, the economist takes a random sample of eight middle-income families of the same size father, mother, and two children). The results are as follows, where x denotes disposable income in thousands of taka and y denotes food expenditure in hundreds of taka. X 30 36 27 20 16 24 19 25 y 45 60 42 40 17 26 39 53 1. Draw a scatter diagram between x and y. 2. Determine and interpret the value of r. 3. Determine the regression equation for the data. 4. Graph the regression equation and the data points. 5. Use the regression equation to predict the annual food expenditure of a family with a disposable income of Tk25000.
Holt Mcdougal Larson Pre-algebra: Student Edition 2012
1st Edition
ISBN:9780547587776
Author:HOLT MCDOUGAL
Publisher:HOLT MCDOUGAL
Chapter11: Data Analysis And Probability
Section: Chapter Questions
Problem 8CR
Related questions
Question
answer the question 3,4,5

Transcribed Image Text:Q2. An economist is interested in the relationship between the disposable income of a family and the amount of money spent
annually on food. For a preliminary study, the economist takes a random sample of eight middle-income families of the same size
father, mother, and two children). The results are as follows, where x denotes disposable income in thousands of taka and y
denotes food expenditure in hundreds of taka.
X
30 36 27 20 16 24 19 25
y
45 60 42 40 17 26 39 53
1. Draw a scatter diagram between x and y.
2. Determine and interpret the value of r.
3. Determine the regression equation for the data.
4. Graph the regression equation and the data points.
5. Use the regression equation to predict the annual food expenditure of a family with a disposable income of Tk25000.
Expert Solution
This question has been solved!
Explore an expertly crafted, step-by-step solution for a thorough understanding of key concepts.
This is a popular solution!
Trending now
This is a popular solution!
Step by step
Solved in 2 steps with 6 images

Recommended textbooks for you

Holt Mcdougal Larson Pre-algebra: Student Edition…
Algebra
ISBN:
9780547587776
Author:
HOLT MCDOUGAL
Publisher:
HOLT MCDOUGAL

Algebra & Trigonometry with Analytic Geometry
Algebra
ISBN:
9781133382119
Author:
Swokowski
Publisher:
Cengage

Holt Mcdougal Larson Pre-algebra: Student Edition…
Algebra
ISBN:
9780547587776
Author:
HOLT MCDOUGAL
Publisher:
HOLT MCDOUGAL

Algebra & Trigonometry with Analytic Geometry
Algebra
ISBN:
9781133382119
Author:
Swokowski
Publisher:
Cengage