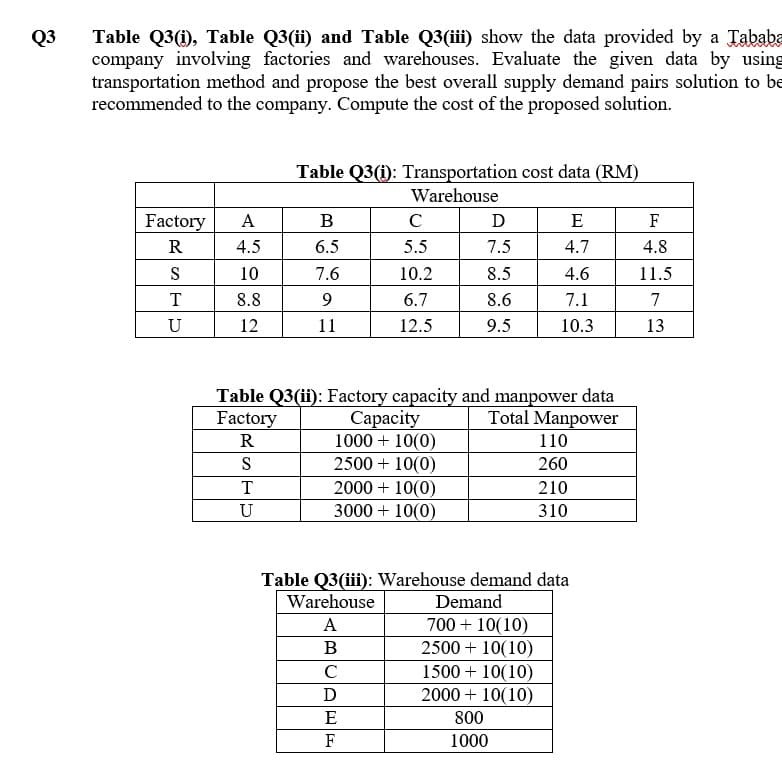
Q3 Table Q3(i), Table Q3(ii) and Table Q3(iii) show the data provided by a Tababa company involving factories and warehouses. Evaluate the given data by using transportation method and propose the best overall supply demand pairs solution to be recommended to the company. Compute the cost of the proposed solution. Factory A R 4.5 S 10 T 8.8 U 12 Table Q3(1): Transportation cost data (RM) Warehouse S T U B 6.5 7.6 9 11 C 5.5 10.2 6.7 12.5 Capacity 1000 + 10(0) 2500 + 10(0) 2000 + 10(0) 3000 + 10(0) E F D 7.5 8.5 8.6 9.5 Table Q3(ii): Factory capacity and manpower data Factory Total Manpower R E 4.7 Demand 700 + 10(10) 2500 + 10(10) 4.6 7.1 10.3 1500 + 10(10) 2000 + 10(10) 800 1000 Table Q3(iii): Warehouse demand data Warehouse A B C D 110 260 210 310 F 4.8 11.5 7 13
Q3 Table Q3(i), Table Q3(ii) and Table Q3(iii) show the data provided by a Tababa company involving factories and warehouses. Evaluate the given data by using transportation method and propose the best overall supply demand pairs solution to be recommended to the company. Compute the cost of the proposed solution. Factory A R 4.5 S 10 T 8.8 U 12 Table Q3(1): Transportation cost data (RM) Warehouse S T U B 6.5 7.6 9 11 C 5.5 10.2 6.7 12.5 Capacity 1000 + 10(0) 2500 + 10(0) 2000 + 10(0) 3000 + 10(0) E F D 7.5 8.5 8.6 9.5 Table Q3(ii): Factory capacity and manpower data Factory Total Manpower R E 4.7 Demand 700 + 10(10) 2500 + 10(10) 4.6 7.1 10.3 1500 + 10(10) 2000 + 10(10) 800 1000 Table Q3(iii): Warehouse demand data Warehouse A B C D 110 260 210 310 F 4.8 11.5 7 13

Chapter15: Retailing, Direct Marketing, And Wholesaling
Section15.1: L.l.bean: Open 24/7, Click Or Brick
Problem 3VC

Related questions
Question
Please answer quickly
Transcribed Image Text:Q3
Table Q3(i), Table Q3(ii) and Table Q3(iii) show the data provided by a Tababa
company involving factories and warehouses. Evaluate the given data by using
transportation method and propose the best overall supply demand pairs solution to be
recommended to the company. Compute the cost of the proposed solution.
Factory A
R
4.5
S
10
T
8.8
U
12
Table Q3(i): Transportation cost data (RM)
Warehouse
T
U
B
6.5
7.6
9
11
C
5.5
10.2
6.7
12.5
Table Q3(ii): Factory capacity and manpower data
Factory
Total Manpower
R
S
Capacity
1000 + 10(0)
2500 + 10(0)
2000 + 10(0)
3000 + 10(0)
D
7.5
8.5
8.6
9.5
E
F
E
4.7
4.6
7.1
10.3
Demand
700 + 10(10)
2500 + 10(10)
1500 + 10(10)
2000 + 10(10)
800
1000
110
260
Table Q3(iii): Warehouse demand data
Warehouse
A
B
C
D
210
310
F
4.8
11.5
7
13
Expert Solution
This question has been solved!
Explore an expertly crafted, step-by-step solution for a thorough understanding of key concepts.

Step by step
Solved in 2 steps with 5 images

Recommended textbooks for you