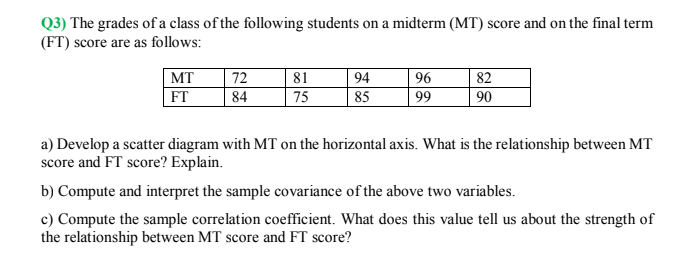
Q3) The grades of a class of the following students on a midterm (MT) score and on the final term (FT) score are as follows: MT 72 81 94 96 82 FT 84 75 85 99 90 a) Develop a scatter diagram with MT on the horizontal axis. What is the relationship between MT score and FT score? Explain. b) Compute and interpret the sample covariance of the above two variables. c) Compute the sample correlation coefficient. What does this value tell us about the strength of the relationship between MT score and FT score?
Q3) The grades of a class of the following students on a midterm (MT) score and on the final term (FT) score are as follows: MT 72 81 94 96 82 FT 84 75 85 99 90 a) Develop a scatter diagram with MT on the horizontal axis. What is the relationship between MT score and FT score? Explain. b) Compute and interpret the sample covariance of the above two variables. c) Compute the sample correlation coefficient. What does this value tell us about the strength of the relationship between MT score and FT score?

College Algebra (MindTap Course List)
12th Edition
ISBN:9781305652231
Author:R. David Gustafson, Jeff Hughes
Publisher:R. David Gustafson, Jeff Hughes
Chapter8: Sequences, Series, And Probability
Section8.7: Probability
Problem 6E: List the sample space of each experiment. Tossing three coins

Related questions
Question
Transcribed Image Text:Q3) The grades of a class of the following students on a midterm (MT) score and on the final term
(FT) score are as follows:
| 82
MT
FT
72
81
94
96
84
75
85
99
90
a) Develop a scatter diagram with MT on the horizontal axis. What is the relationship between MT
score and FT score? Explain.
b) Compute and interpret the sample covariance of the above two variables.
c) Compute the sample correlation coefficient. What does this value tell us about the strength of
the relationship between MT score and FT score?
Expert Solution
This question has been solved!
Explore an expertly crafted, step-by-step solution for a thorough understanding of key concepts.

Step by step
Solved in 4 steps with 5 images

Recommended textbooks for you
College Algebra (MindTap Course List)
Algebra
ISBN:
9781305652231
Author:
R. David Gustafson, Jeff Hughes
Publisher:
Cengage Learning
College Algebra (MindTap Course List)
Algebra
ISBN:
9781305652231
Author:
R. David Gustafson, Jeff Hughes
Publisher:
Cengage Learning