Q4/ Calculate the Quartile Deviation (Q.D) and coefficient of Q.D. for the data: Class 10-20 20-30 30-40 40-50 50-60 60-70 Interval Frequency | 5 8. 21 13 31
Q4/ Calculate the Quartile Deviation (Q.D) and coefficient of Q.D. for the data: Class 10-20 20-30 30-40 40-50 50-60 60-70 Interval Frequency | 5 8. 21 13 31

Glencoe Algebra 1, Student Edition, 9780079039897, 0079039898, 2018
18th Edition
ISBN:9780079039897
Author:Carter
Publisher:Carter
Chapter10: Statistics
Section10.5: Comparing Sets Of Data
Problem 13PPS

Related questions
Question
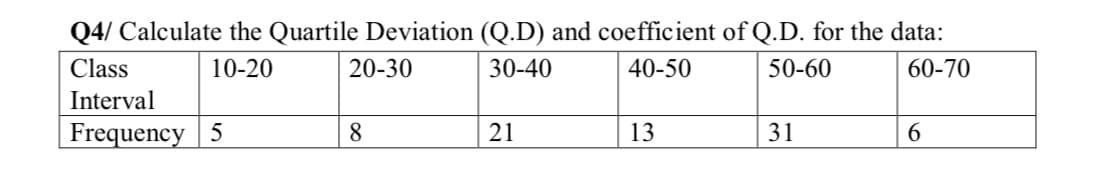
Transcribed Image Text:Q4/ Calculate the Quartile Deviation (Q.D) and coefficient of Q.D. for the data:
Class
10-20
20-30
30-40
40-50
50-60
60-70
Interval
Frequency | 5
21
13
31
6.
Expert Solution
This question has been solved!
Explore an expertly crafted, step-by-step solution for a thorough understanding of key concepts.

Step by step
Solved in 2 steps

Knowledge Booster


Learn more about
Need a deep-dive on the concept behind this application? Look no further. Learn more about this topic, statistics and related others by exploring similar questions and additional content below.Recommended textbooks for you
Glencoe Algebra 1, Student Edition, 9780079039897…
Algebra
ISBN:
9780079039897
Author:
Carter
Publisher:
McGraw Hill
Glencoe Algebra 1, Student Edition, 9780079039897…
Algebra
ISBN:
9780079039897
Author:
Carter
Publisher:
McGraw Hill