Q4: For the following data, if the coefficient of variance (C.V) and the standard deviation (SD) are 13.9321 ,and 2.4381 respectively. Thus
Q4: For the following data, if the coefficient of variance (C.V) and the standard deviation (SD) are 13.9321 ,and 2.4381 respectively. Thus

Glencoe Algebra 1, Student Edition, 9780079039897, 0079039898, 2018
18th Edition
ISBN:9780079039897
Author:Carter
Publisher:Carter
Chapter10: Statistics
Section10.4: Distributions Of Data
Problem 19PFA

Related questions
Question
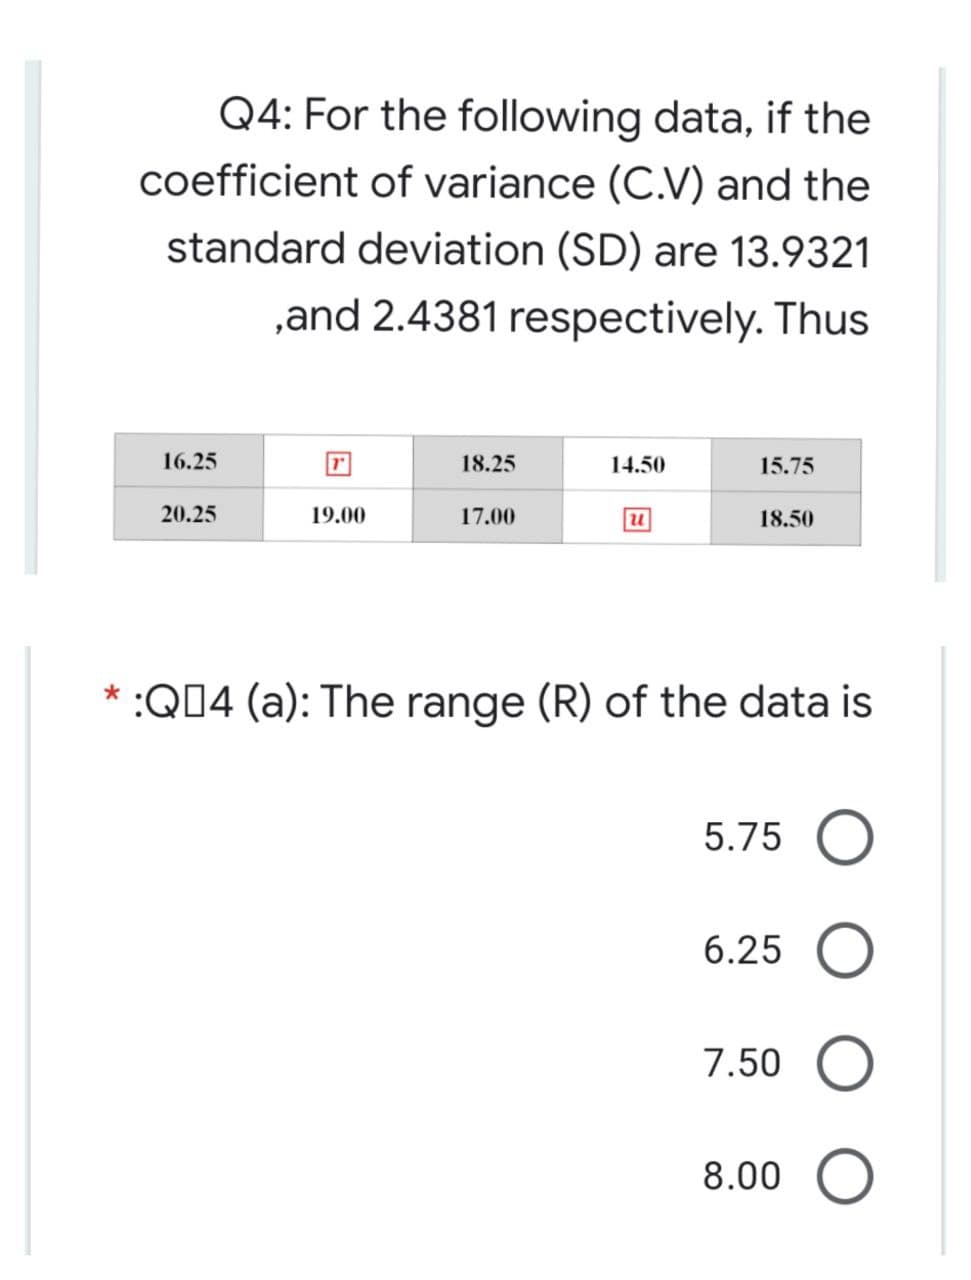
Transcribed Image Text:Q4: For the following data, if the
coefficient of variance (C.V) and the
standard deviation (SD) are 13.9321
,and 2.4381 respectively. Thus
16.25
18.25
14.50
15.75
20.25
19.00
17.00
u
18.50
*:Q04 (a): The range (R) of the data is
5.75 O
6.25 O
7.50
8.00
Expert Solution
This question has been solved!
Explore an expertly crafted, step-by-step solution for a thorough understanding of key concepts.

Step by step
Solved in 4 steps with 4 images

Recommended textbooks for you
Glencoe Algebra 1, Student Edition, 9780079039897…
Algebra
ISBN:
9780079039897
Author:
Carter
Publisher:
McGraw Hill
Glencoe Algebra 1, Student Edition, 9780079039897…
Algebra
ISBN:
9780079039897
Author:
Carter
Publisher:
McGraw Hill