Q1) The following data represent the difference in scores between the winning and losing teams in a sample of 15 college football bowl games from 2004- 2005. Point Difference Number of Bowl Games 1-5 8. 6-10 11 - 15 16 - 20 21 - 25 26 30 1 31 35 1 Find each of the following: 1- The variance 2- Coefficient of variation 3- Interquartile range
Q1) The following data represent the difference in scores between the winning and losing teams in a sample of 15 college football bowl games from 2004- 2005. Point Difference Number of Bowl Games 1-5 8. 6-10 11 - 15 16 - 20 21 - 25 26 30 1 31 35 1 Find each of the following: 1- The variance 2- Coefficient of variation 3- Interquartile range

Glencoe Algebra 1, Student Edition, 9780079039897, 0079039898, 2018
18th Edition
ISBN:9780079039897
Author:Carter
Publisher:Carter
Chapter10: Statistics
Section10.5: Comparing Sets Of Data
Problem 14PPS

Related questions
Topic Video
Question
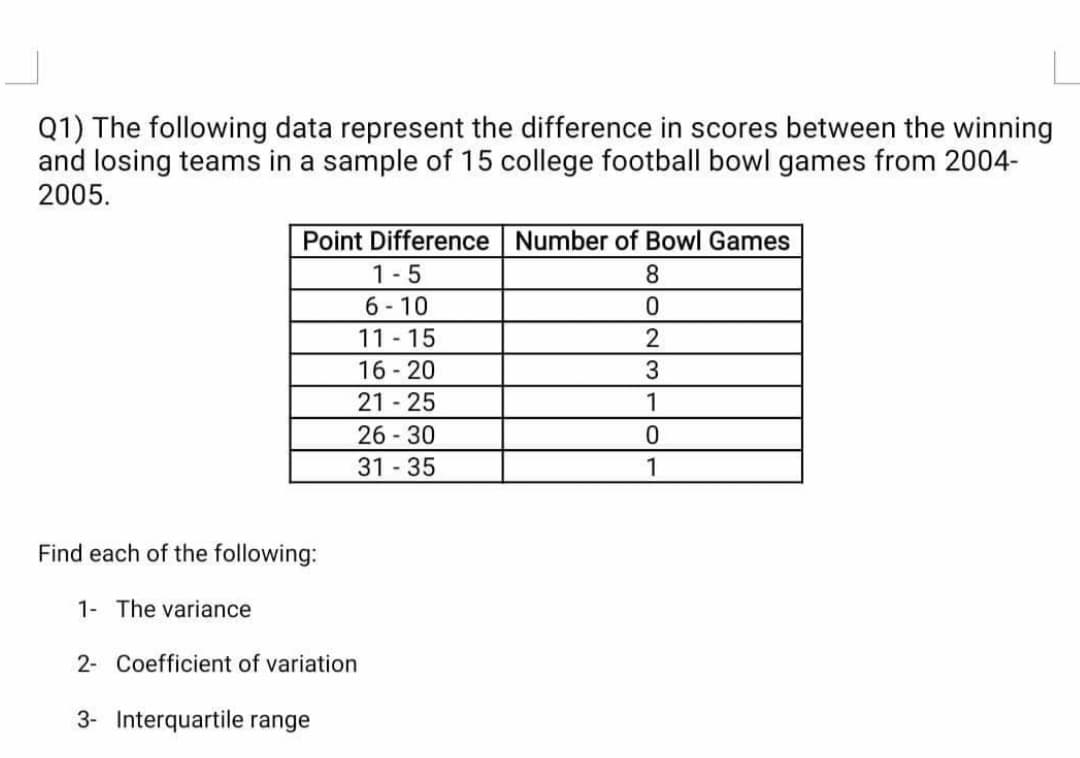
Transcribed Image Text:Q1) The following data represent the difference in scores between the winning
and losing teams in a sample of 15 college football bowl games from 2004-
2005.
Point Difference Number of Bowl Games
1-5
8.
6- 10
11 - 15
16 - 20
21 - 25
26 - 30
2
3
1
31 35
1
Find each of the following:
1- The variance
2- Coefficient of variation
3- Interquartile range
Expert Solution
This question has been solved!
Explore an expertly crafted, step-by-step solution for a thorough understanding of key concepts.

This is a popular solution!

Trending now
This is a popular solution!

Step by step
Solved in 2 steps

Knowledge Booster


Learn more about
Need a deep-dive on the concept behind this application? Look no further. Learn more about this topic, statistics and related others by exploring similar questions and additional content below.Recommended textbooks for you
Glencoe Algebra 1, Student Edition, 9780079039897…
Algebra
ISBN:
9780079039897
Author:
Carter
Publisher:
McGraw Hill
Glencoe Algebra 1, Student Edition, 9780079039897…
Algebra
ISBN:
9780079039897
Author:
Carter
Publisher:
McGraw Hill