Q4) Ten samples of size four were taken from a process, and their weights measured. The sample averages and sample ranges are in the following table. Construct and plot an x-bar and R-chart using these data. Is the process in control? Sample Mean Range 1 20.01 0.45 2 19.98 0.67 3 20.25 0.30 4 19.90 0.30 5 20.35 0.36 6 19.23 0.49 7 20.01 0.53 8 19.98 0.40 9 20.56 0.95 10 19.97 0.79


Q: Charles Lackey operates a bakery in Idaho Falls, Idaho. Because of its excellent product and…
A: Given data The organization makes cloves per month (output) = 1600 units or loaves Cost of the…
Q: QUESTION 2 (10 Marks) The Goode and Cooke Company produces several models of frying pans. There is…
A: Production(P) = 160 crying pan Shift time(S) = 8 hour Number of shift(N) = 2 Number of working…
Q: Define Omni-channel logistics in your own words. Do you think the Omni-channel logistics model is…
A: Logistic:- The term "logistics" describes the total process of controlling the acquisition, storage,…
Q: Problem 2-3 (Algo) Compute the multifactor productivity measure for each of the weeks shown for…
A: Weekly hour = 40 Hourly wage = $16 Labor cost(L) = 40 x $16 = $640 Overhead cost = $1.5 times…
Q: Discuss a company that is known to be a low-cost producer in its industry and consider why it is a…
A: Low producers can be stated as the term that is used in the business sector and industries to define…
Q: A careful analysis of the cost of operating an automobile was conducted by accounting manager Dia…
A: Solution Model y = 4000+0.20x Annual cost = y Miles drive = x Given that, x = 15000
Q: Your Lego furniture company makes Tables and Chairs. Below, you are given the starting inventory,…
A: Let Table = T and Chair = C For scenario 2 maximize revenue = 42 T + 29 C subject to 4T +…
Q: What advantages can project management collaboration tools offer?
A: Online collaboration generally refers to the software programs or tools that help businesses and…
Q: a. Calculate ALL the missing (?) data points. b. Draw the PERT network from the given data. c.…
A: Critical path is the longest of all the paths.
Q: Provide an example to distinguish strategy from strategic plan.
A: The strategy is not so very different from a strategic plan. A strategy is when the expert team…
Q: Discuss the golden rule level of capital using a diagram and explain why it is beneficial?
A: The meaning of the "Golden Rule of Capital Accumulation" At the very least, the Solow model…
Q: Use the data below to solve for the following: 2. Naïve method 3. Unweighted 3 month moving average…
A: Formulae used: 1) Naiive method:Previous period actual data = Current period forecast data.2)…
Q: Dave Fletcher was able to determine the activity times for constructing h ser scanning machine.…
A: 1. During forward pass in case of more than two preceding activities the early start will be…
Q: 3. Hoosier Gasoline Company, or HoosCo as they are known, produces two blends of gasoline, regular…
A: The question is to find the quantity of each type of gasoline that should be produced to maximize…
Q: discuss the four steps in strategic sourcing process, highlighting how DHL can apply each step to…
A: Strategic Sourcing:- A order for a firm known as "strategic sourcing" integrates data gathering,…
Q: Question: 14. Which of the following statements regarding an Erlang loss system is TRUE? A. The…
A: Erlang loss system is a queueing system where multiple servers are serving the customers. The…
Q: 10. Parts arrive at a lathe at a rate of 20 every half hour. Each part must be processed on the…
A: Since you have asked multiple questions, we will solve the first question for you. If you want any…
Q: The word "full-service provider" may be associated with a few different meanings. What are the…
A: The various advantages of working with suppliers that provide variety of services are, 1. Timely…
Q: 4. Simple Exponential Smoothing: Use a smoothing parameter, α = 0.3. Month Ft 1 2 3 4 5 678 9 10 No.…
A: Exponential smoothing is a forecasting model which using the actual demand and forecasting f=demand…
Q: Charles Lackey operates a bakery in Idaho Falls, Idaho. Because of its excellent product and…
A: As a metric of economic performance, multi factor productivity looks at how output compares to the…
Q: 1. Job: Installing an IT System at Bana Bank Zambia Ltd. (08-04- 2022 to 20-05- 2022) ACTIVITY…
A: Find the Given details below: Activity Week No. of Workdays A 1 5 B - 3 C - 2 D - 2 E -…
Q: How can one maintain composure when responding to dangerous and volatile situations? for example a…
A: An individual as a leader always needs to show more composure in the workplace. With respect to the…
Q: Why is Strategy important and what are the types of Strategy?
A: Strategy can be stated as the action plan that is designed by the management of the organization for…
Q: 140 Friday Using this table above, solve for Mean Absolute Deviation (MAD) xample 9.6568->9.66
A: Absolute error = |actual-forecast| MAD = Average |actual-forecast|
Q: You work for the Brad's Nailer Company which manufactures two types of nailers: a pneumatic model…
A: Let 'P' be pneumatic nailers to be produced, and let 'C' be the cordless nailers to be produced. Min…
Q: You are at Disney World and wait 45 minutes to ride the roller coaster at Space Mountain. Guests…
A: Given: Waiting time = 45 minutesTotal ride time = 3 minutes
Q: Describe the operations function and the nature of the operations manager's job. NOTE: please refer…
A: the operations consist of different activities which can be of the following types - producing goods…
Q: Brown's, a local bakery, is worried about increased costs particularly energy. Last year's records…
A: Productivity is the ability to produce in an effective and efficient manner in an organisation.
Q: question one Using cocaccola as an organization of your choice, discuss the relationship between…
A: Production management:- Planning, organising, and redesigning the production process for goods or…
Q: You have a new job as a Financial Planning assistant. Your client wants to invest money in stocks,…
A: Objective Functions and Constraints (Scenario 2): Based on the given details, the…
Q: Describe the 4 domains of human resources. Which domain is most significant, and why
A: Human resources can be stated as the group of individuals who make up the employees of the company,…
Q: At syntecks, the output of a specific process is valued at $100 per unit. The cost of labor is $50…
A: Week 1 Week 2 Week 3 Week 4 Labor $12735 $14842 $10603 $9526 Material $21041 $24523 $20442…
Q: In relation to the low levels of diversification, mention an example (a company) and explain
A: A diversification strategy is generally used when the organization wishes to grow. Diversification…
Q: QUESTION 2 a) Assess and discuss major expenses related to run to fail maintenance. In your opinion,…
A: Effective Maintenance:- According to Effective Maintenance, lowering equipment costs across the…
Q: hat would be your production rate each month? A. 4250 B. 3500 OC. 4250, 3000, 4000, 5000 OD. 2000,…
A: Production is the process in which inputs are combined to have the required output. It includes a…
Q: Why, if you were the project manager, would you utilize collaborative software?
A: Collaborative software can be stated as the software that is generally designed to increment the…
Q: Your Lego furniture company makes Tables and Chairs. Below, you are given the starting inventory,…
A: The question stated to use scenario 2.
Q: (a) Use the graphical solution procedure to find the optimal solution. What is the value of the…
A: As per Bartleby guidelines, we can only solve the first three subparts of one question at a…
Q: Liva's Lumber, Inc., manufactures three types of plywood. The following table summarizes the…
A: Decision variable: Suppose-x1 be the no. of Grade A type of plywood to be producedx2 be the no. of…
Q: Fush uses an average of 40 boxes of paper serviettes a day. The restaurant operates 260 days per…
A: Economic order quantity is an inventory management technique which helps to identify the optimal…
Q: -A Hot dog mixture in 1000-pound batches. Two ingredients is needed to create the mixture, chicken…
A: Decision Variable: Suppose- X1 be the pound of chicken used as an ingredientX2 be the pound of…
Q: We live in a world that is sharing fast information all around the world, where travel is becoming…
A: Business environment:- The word "business environment" refers to the entirety or collection of all…
Q: Provide at least five project stakeholders as well as the role they play in the Construction…
A: The word stakeholders is often used to refer to those who care about the success of a project or…
Q: 7) Explain Heinrich's Triangle and discuss how the application of the concept reduces workplace…
A: Heinrich's Accident Triangle is also known as the Accident Triangle or Bird's Triangle. It…
Q: Consider the bill of material for a product, A, and the data given in the table that follows. The…
A: The Gross requirements : For A's = 150 Units in week 5 For B's = 200 Units in week 8 To be…
Q: The BBK Hot Sauce Company can produce three types of hot sauce, the Heatwave, the Inferno and the…
A: Given data is Number of boxes of Jalapeno peppers and Scotch bonnet peppers required by each sauce.…
Q: Calculating outcomes as equally likely would BEST describe: O a. Maximax criterion O b. Laplace…
A: As per Bartleby guidelines, we can only solve one question at a time...Kindly upload the other…
Q: A company that makes shopping carts for supermarkets and other stores recently purchased some new…
A: Productivity is the measure of output produced per input used. Productivity = output/input
Q: The unique nature of humanitarian emergencies is explained by Long and Wood. They give various…
A: Logistics can be broadly defined as the planning, implementing, and controlling the physical flow of…
Q: Tyler Apiaries sells bees and beekeeping supplies. Bees (including a queen) are shipped in special…
A: given that: average 1.4 std.deviation 0.16 USL 1.8 LSL 1.2
Q4) Ten samples of size four were taken from a process, and their weights measured. The sample averages and sample ranges are in the following table. Construct and plot an x-bar and R-chart using these data. Is the process in control?
|
Sample |
Mean |
Range |
|
1 |
20.01 |
0.45 |
|
2 |
19.98 |
0.67 |
|
3 |
20.25 |
0.30 |
|
4 |
19.90 |
0.30 |
|
5 |
20.35 |
0.36 |
|
6 |
19.23 |
0.49 |
|
7 |
20.01 |
0.53 |
|
8 |
19.98 |
0.40 |
|
9 |
20.56 |
0.95 |
|
10 |
19.97 |
0.79 |


Trending now
This is a popular solution!

Step by step
Solved in 2 steps with 4 images

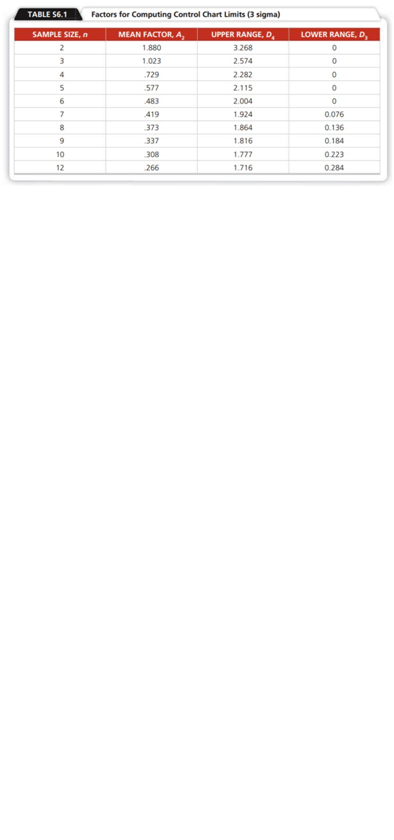
- 5. Elton Mayo is best associated with the Hawthorne studies which were conducted at the Hawthorn plant of Western Electric in Cicero, Illinois?a. TRUE b. FALSE6. By definition, an objective deal with achieving a measurable result with due regard to time.a.True b. FalseFind the maximum and minimum values of f(x) = x3 − 6x2 + 8 on the horizontal span of 0 to 10.Refer to Table S6.1 - Factors for Computing Control Chart Limits (3 sigma) for this problem. Sample Size, n Mean Factor, A2 Upper Range, D4 Lower Range, D3 2 1.880 3.268 0 3 1.023 2.574 0 4 0.729 2.282 0 5 0.577 2.115 0 6 0.483 2.004 0 7 0.419 1.924 0.076 8 0.373 1.864 0.136 9 0.337 1.816 0.184 10 0.308 1.777 0.223 12 0.266 1.716 0.284 Auto pistons at Wemming Chung's plant in Shanghai are produced in a forging process, and the diameter is a critical factor that must be controlled. From sample sizes of 10 pistons produced each day, the mean and the range of this diameter have been as follows: Day Mean Bold x overbarx (mm) Range R (mm) 1 154.9154.9 4.04.0 2 151.2151.2 4.44.4 3 153.6153.6 3.93.9 4 155.5155.5 5.05.0 5 158.6158.6 4.3 a) What is the value of x? X = ____ mm b) What is the value of R? R =…
- Rajan wanted a radio from Jacky's. It appears that Rajan is particularly interested in purchasing a Radio from the inexpensive retailer's sales manager for consumer electronics. He tells Jacky, the salesperson at the inexpensive store where he thinks he'll get the best deal, that his old radio died and he wants to listen to his favourite tunes. He wants a replacement radio as quickly as possible. In three and a half weeks, Rajan's favourite model will be 10% off.He suspects Rajan won't wait and will find another job. Jacky will earn less on the lowered price. He thinks that telling Rajan of the sale makes little sense.When Jacky tells Rajan that the radio set he wants is no longer available and won't be for another week, Rajan is enraged. Fearing losing the business, Jacky begs his sales manager, Michelle, to speed up delivery. Michelle says it's impossible and suggests Jacky tell Rajan the store can get the set in 24 hours and sell him the demo model. Michelle says the sample is new…Alcohol Dragster On board most alcohol dragsters is a computer that compiles datainto a number of different categories during each race. The table below shows someof the actual data from a past race.Time inseconds The front wheels, at each end of the front axle, are 22.07 inches in diameter. Derive aformula that will convert rpm’s from a 22.07-inch wheel into miles per hour. Test yourformula on all six rows of the table. Explain any discrepancies between the table valuesand the values obtained from your formula.6. List and explain in detail why we include disturbance term or error term in the model?
- Vilfredo Pareto was a famous engineer/economist in the 19th and early 20th centuries. He reportedly expressed this 80/20 Rule: 80% of all progress results from 20% of the actions taken. The Pareto Diagram, also called a Juran Diagram, depicts a variant 80/20 Rule: 80% of all production problems come from 20% of the problem areas. a. What kind of statistical chart is the Pareto Diagram? ____ (enter H for histogram, P for probability distribution, T for a Taguchi chart, A for all three of these. N for none of these. b. The value of the Pareto Diagram is its highlighting the areas causing 80% of quality problems. ____ (enter T for true or F for false)"The table below is data on telephone usage time by operators to serve customer requests that will be used to explain the use of Xbar and R-chart". Question: a. Create UCL and LCL with Limit Control Factor A2b. Create UCL and LCL with Limit Control Factor D3 and D4Compute CL, UCL, and LCL of MR and X Control Charts for the following data. Batch Number Flowrate X Moving Range MR 1 49.6 2 47.6 3 49.9 4 51.3 5 47.8 6 51.2 7 52.6 8 52.4 9 53.6 10 52.1
- South Africa Airways would like to monitor its airline’s performance. Each week for the past 20 weeks, they checked each week a random sample of 100 flight arrivals for “one-time” performance. The table that follows contains the number of flights that did not meet South Africa Airways definition of “one time”: Week Late flights 1 2 2 4 3 10 4 4 5 1 6 1 7 13 8 9 9 11 10 0 11 3 12 4 13 2 14 2 15 8 16 2 17 3 18 7 19 3 20 2 Which control chart is appropriate to analyze the above data? Justify your answerSouth Africa Airways would like to monitor its airline’s performance. Each week for the past 20 weeks, they checked each week a random sample of 100 flight arrivals for “one-time” performance. The table that follows contains the number of flights that did not meet South Africa Airways definition of “one time”: Week Late flights 1 2 2 4 3 10 4 4 5 1 6 1 7 13 8 9 9 11 10 0 11 3 12 4 13 2 14 2 15 8 16 2 17 3 18 7 19 3 20 2 Calculate the upper and lower control limits for this chart.ASQ (The American Society for Quality) Defines a Six Sigma project as: Six Sigma is a method for reducing variation in manufacturing, service, or other business processes. Six Sigma projects measure the cost benefit of improving processes that are producing substandard products or services. Whether in manufacturing or service industries, such projects quantify the effect of process changes on delays or rework. The goal of each successful Six Sigma project is to produce statistically significant improvements in the target process; over time, multiple Six Sigma projects produce virtually defect-free performance. The Six Sigma Black Belt project is one that uses appropriate tools within a Six Sigma approach to produce breakthrough performance and real financial benefit to an operating business or company. The tools are generic. It is the structure of the project and the associated process (improvement model) that distinguish a Black Belt project from other similar quality improvement…