Q5/ The harmonic mean of the frequency distribution is 47 70 87 45 17 33 90 57 72 65 69 35 49 40 10 22 29 70 44 77 45 59 54 53 66 81 67 41 19 71 80 87 50 58 22 Put these data in a frequency distribution with five classes of length 20, each starting from 1 to 100, meaning that the first class is from 1 to 20. Then find the relative and annual frequency distribution, and answer the following questions
Q5/ The harmonic mean of the frequency distribution is 47 70 87 45 17 33 90 57 72 65 69 35 49 40 10 22 29 70 44 77 45 59 54 53 66 81 67 41 19 71 80 87 50 58 22 Put these data in a frequency distribution with five classes of length 20, each starting from 1 to 100, meaning that the first class is from 1 to 20. Then find the relative and annual frequency distribution, and answer the following questions

Holt Mcdougal Larson Pre-algebra: Student Edition 2012
1st Edition
ISBN:9780547587776
Author:HOLT MCDOUGAL
Publisher:HOLT MCDOUGAL
Chapter11: Data Analysis And Probability
Section11.1: Stem-and-leaf Plots And Histograms
Problem 5E

Related questions
Question
I need answer within 20 minutes please please with my best wishes
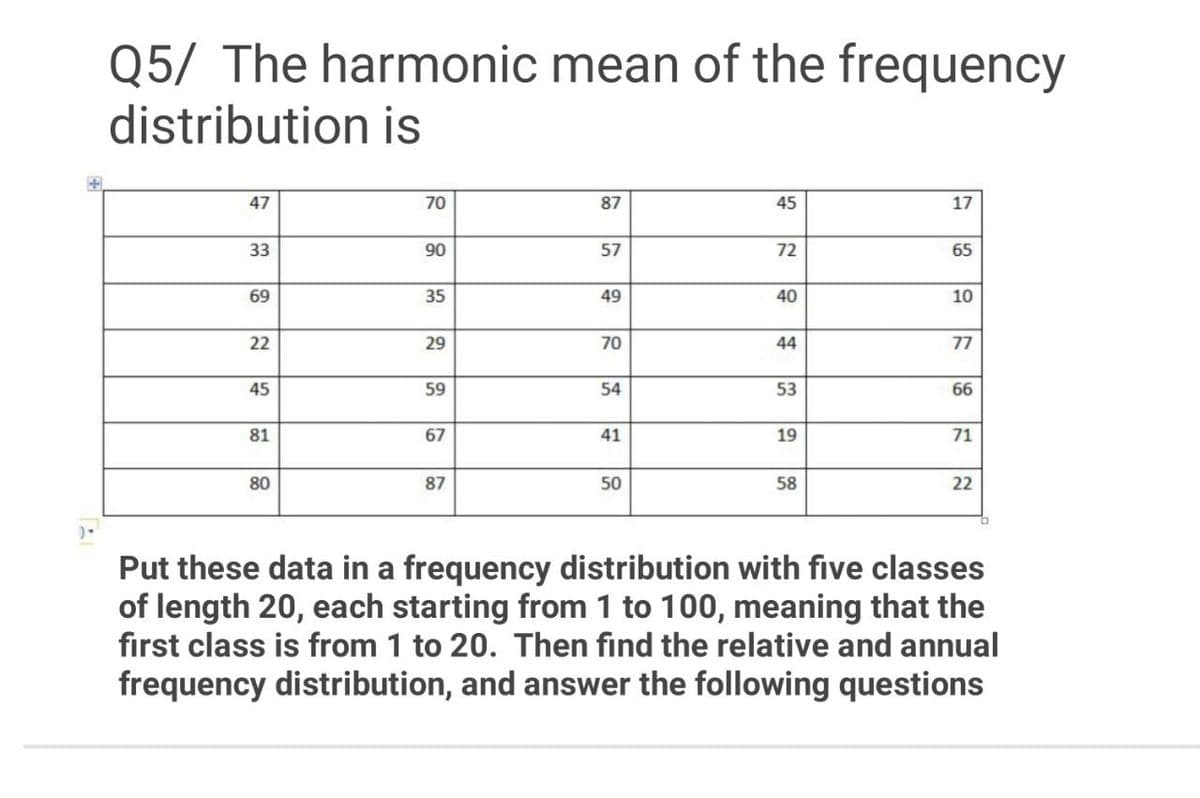
Transcribed Image Text:Q5/ The harmonic mean of the frequency
distribution is
47
70
87
45
17
33
90
57
72
65
69
35
49
40
10
22
29
70
44
77
45
59
54
53
66
81
67
41
19
71
80
87
50
58
22
Put these data in a frequency distribution with five classes
of length 20, each starting from 1 to 100, meaning that the
fırst class is from 1 to 20. Then find the relative and annual
frequency distribution, and answer the following questions
Expert Solution
This question has been solved!
Explore an expertly crafted, step-by-step solution for a thorough understanding of key concepts.

Step by step
Solved in 2 steps

Recommended textbooks for you
Holt Mcdougal Larson Pre-algebra: Student Edition…
Algebra
ISBN:
9780547587776
Author:
HOLT MCDOUGAL
Publisher:
HOLT MCDOUGAL
Holt Mcdougal Larson Pre-algebra: Student Edition…
Algebra
ISBN:
9780547587776
Author:
HOLT MCDOUGAL
Publisher:
HOLT MCDOUGAL