
A First Course in Probability (10th Edition)
10th Edition
ISBN: 9780134753119
Author: Sheldon Ross
Publisher: PEARSON
expand_more
expand_more
format_list_bulleted
Question

Transcribed Image Text:
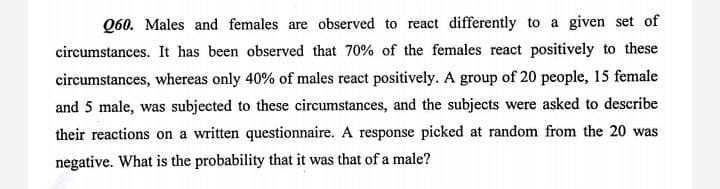
Q60. Males and females are observed to react differently to a given set of
circumstances. It has been observed that 70% of the females react positively to these
circumstances, whereas only 40% of males react positively. A group of 20 people, 15 female
and 5 male, was subjected to these circumstances, and the subjects were asked to describe
their reactions on a written questionnaire. A response picked at random from the 20 was
negative. What is the probability that it was that of a male?
Expert Solution

This question has been solved!
Explore an expertly crafted, step-by-step solution for a thorough understanding of key concepts.
This is a popular solution
Trending nowThis is a popular solution!
Step by stepSolved in 2 steps with 1 images

Knowledge Booster
Learn more about
Need a deep-dive on the concept behind this application? Look no further. Learn more about this topic, probability and related others by exploring similar questions and additional content below.Similar questions
- Week 10. Question 6 In a research report, suppose a researcher states that they ‘randomly’ stopped passers-by in a shopping centre to get responses for their survey. Explain why this process is not truly random.arrow_forwardSuppose you were presented with the results of a study comparing two different training methods for basketball athletes. You are told 32 athletes were randomly assigned to the two groups so that 16 were in the group A and 16 were in the group B. At the end of the session, the average scores (wins versus losses) of the two groups/teams were compared and a difference of 10% was observed ( the first team had 10% more wins than the second). The coach observer reports two- sample t-test shows this difference is statistically significant. How would you interpret these findings? What questions or concerns would you have? How might this type of study be improved? Hint: Consider the possibility that the test performed was not the appropriate one.arrow_forwardA. If 75% of high school students are able to pass a stats test, find the mean, variance, and standard deviation for the number of students who pass the test in a sample of 150 students. B. What is the probability that just you will not pass this test, if all 22 students take the test?arrow_forward
- An article about the California lattery gave the following information on the age distribution of adults in California: 35% are between 18 and 34 years old, 51% are between 35 and 64 years old, and 14% are 65 years old or older. The artide also gave Information on the age distribution of those who purchase lottery tickets. The following table is consistent with the values given in the article. Suppose that the data resulted from a random sample of 200 lattery ticket purchasers. Based on these sample data, is it reasonable to condude that ane or more af these three age groups buys a disproportionate share of lottery tickets? Use a chi-square goodness-of-fit test with a- 0.05. (Round your answer to two decimal places.) Age of Purchaser Frequency 18-34 45 35-64 100 65 and over 55 P-value interval Oparrow_forwardThe authors of a research article were interested in the effect on female viewers of watching movies in which female heroines were portrayed in roles that focus on their sex appeal. They carried out an experiment in which female college students were assigned at random to one of two experimental groups. The 24 women in one group watched 13 minutes of scenes from a certain superhero film series and then responded to a questionnaire designed to measure body esteem. Lower scores on this measure correspond to lower body satisfaction. The 29 women in the other group (the control group) did not watch any video prior to responding to the questionnaire measuring body esteem. For the women who watched the video, the mean body esteem score was 4.44 and the standard deviation was 1.02. For the women in the control group, the mean body esteem score was 5.07 and the standard deviation was 0.96. For purposes of this exercise, you may assume that the distribution of body esteem scores for each of the…arrow_forwardApproximately 8% of males experience red-green color blindness. Suppose a random sample of 200 men is chosen.arrow_forwardYou want to examine the relationship between dropping out of high school and delinquency. You have a random sample of 11 students. You have the number of delinquent offenses that each student reported committing in the year before and after dropping out of school. The following table shows the data. Before dropping After dropping Student out out 1 7 2 9. 2 3 4 7 7 8 11 6 11 13 7 8 4 8 8 10 9. 5 7 10 2 1 11 3 From performing a hypothesis test to determine if the mean number of delinquent differs after dropping out, what is the p-value? (Round off to two decimal places if necessary)arrow_forwardIs the national crime rate really going down? Some sociologists say yes! They say that the reason for the decline in crime rates in the 1980s and 1990s is demographics. It seems that the population is aging, and older people commit fewer crimes. According to the FBI and the Justice Department, 70% of all arrests are of males aged 15 to 34 yearst. Suppose you are a sociologist in Rock Springs, Wyoming, and a random sample of police files showed that of 34 arrests last month, 25 were of males aged 15 to 34 years. Use a 10% level of significance to test the daim that the population proportion of such arrests in Rock Springs is different from 70%. A USE SALT (a) What is the level of significance? State the null and alternate hypotheses. O H P 0.7 O H.: p - 0.7; H,: p 5 and ng > S. O The standard normal, since np > 5 and ng > 5. O The Student's t, since nparrow_forwardarrow_back_iosarrow_forward_iosRecommended textbooks for you
- A First Course in Probability (10th Edition)ProbabilityISBN:9780134753119Author:Sheldon RossPublisher:PEARSON
A First Course in Probability (10th Edition)ProbabilityISBN:9780134753119Author:Sheldon RossPublisher:PEARSON