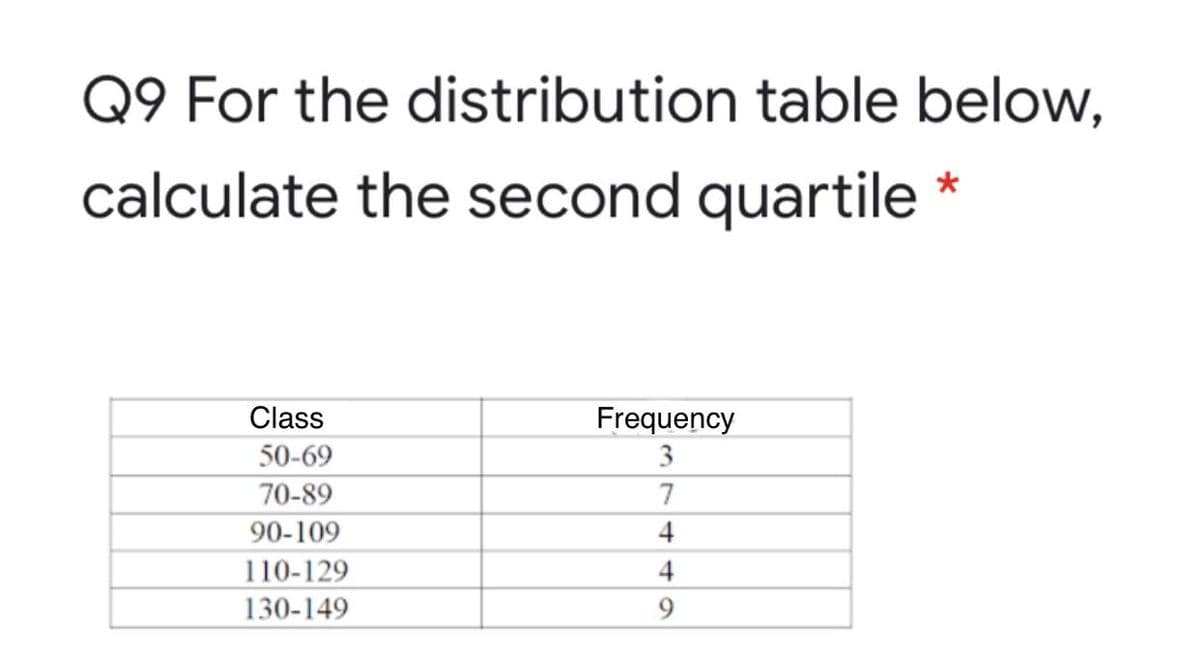
Q9 For the distribution table below, calculate the second quartile * Class Frequency 50-69 3 70-89 7 90-109 4 110-129 4 130-149 9.


Q: Do the data indicate a significant change in the grade distribution? Test at the .05 level of…
A: The following table is obtained: Categories Observed Expected (fo-fe)2/fe A 32 200*0.14=28…
Q: The test scores for two statistics classes are shown below.7. Morning Class:88, 74, 69, 71, 58, 74,…
A: For the given data Write a comparison, in context, between the two distributions using the…
Q: Find the z-score boundaries that divide a normal distribution. The middle 25% from the 75% in the…
A: Solution: From the given information, 25% area lies in the middle of the normal distribution and 75%…
Q: The accompanying table provides theoretical data on marital status and income bracket for a random…
A: The data shows the marital status and income bracket for a random sample of adults age between 20…
Q: he number of points held by a sample of the NHL’s highest scorers for both the Eastern Conference…
A: Given, Eastern Conference Western Conference 83 77 60 59 75 72 68 58 78 37 69 57 70…
Q: Q- 5. Calculate the lower and upper quartiles from the following marks distribution. Marks Below 25…
A:
Q: Find the proportion of Normally distributed observations with a z-score below 2.56. Give your answer…
A: Given Z=2.56
Q: For the population of college students, the number of hours spent studying per week is normally…
A: We have to find out if there is possibility of type 2error.
Q: In order to get into ABC University you need to score in the top 2 5% of its placeme The test…
A:
Q: (a)(i)What is the distribution of the proper test statistic for doing inference for the population…
A: Here length of adult male dolphins are normally distributed Here population standard deviation is…
Q: Find the z-score boundaries that separate the middle 70% from the 30% in the tails in a normal…
A: Find the z-score boundaries that separate the middle 70% from the 30% in the tails in a normal…
Q: The scoring of modern IQ is such that Intelligence Quotients (IQs) have a normal distribution of µ=…
A: Let X denote the intelligence quotients have a normal distribution of mean μ=100 and standard…
Q: What z-score value separates the highest (top) 40% of the exam scores in a normal distribution from…
A: To find The z-score value that separates the highest (top) 40% of the exam scores in a normal…
Q: Parker's Pavers has determined that a paver measuring 5 inches long has a z-score of +1 and a paver…
A: We know that the formula to calculate z Score is given by, Z= (x- Xbar)/sigma Where Xbar is mean and…
Q: 7. Construct a box plot for this distribution and clearly label the quartile boundaries. [Refer to…
A: Calculate Box and Whisker Plots from the following data35,66,49,32,57,31,57,39,41,33
Q: Use the box-and-whisker diagram to: (i) (ii) (iii) Determine the minimum and the maximum of th Сopy…
A: (i) According to box and whisker plot the minimum age is 30 and maximum age is 55. Q1=35, Q2=45,…
Q: A sample of n=6 Scores has a mean of X=10.What is the value of £X Data set…
A: As given, n = 6 Mean of X = 10 It is asked to find the value of ΣX. →The formula for the mean…
Q: The average number of cavities that thirty-year-old Americans have had in their lifetimes is 9. Do…
A: Note- Since you have posted a question with multiple sub-parts, we will solve the first three…
Q: The table shows the distribution for the number of employees in 40 companies belonging to a…
A: The provided information is Number of Employees Number of Companies (f) Class Boundaries cf…
Q: It was hypothesized that there will be a difference in the average test score in Chemistry class…
A: Denote μ1, μ2 as the true average test scores in Chemistry class between high schoolers who watched…
Q: For a normal distribution, what z-score value separates the lowest 20% of the distribution from the…
A: The z-score value separates the lowest 20% of the distribution from the highest 80% is, PZ<z=0.20…
Q: The test scores for a sample of 20 students who are entering their first year courses of Brac…
A:
Q: Before the furniture store began its ad campaign, it averaged 213 customers per day. The manager is…
A: D. Consider that μ defines the population mean number of customers. Here, it is needed to check…
Q: Before the furniture store began its ad campaign, it averaged 213 customers per day. The manager is…
A: Note- As per our policy we can answer only the first 3 sub-parts of a question. If you want…
Q: The amount of time, in minutes, that a person must wait for a bus is uniformly distributed between…
A:
Q: It was hypothesized that there will be a difference in the average test score in Chemistry class…
A: Denote μ1, μ2 as the population average test scores in Chemistry class of high schoolers who watched…
Q: Find the proportion of Normally distributed observations with a zz-score below 0.82. Give your…
A:
Q: Describe the usage of F distribution, normal distribution and chi -sqaure distribtuon for evaluating…
A: There are large number of probability distributions used in statistical applications. A…
Q: Before the furniture store began its ad campaign, it averaged 146 customers per day. The manager is…
A: I checked your work and your calculated test statistic , t , P-value and decision are absolutely…
Q: Before the furniture store began its ad campaign, it averaged 182 customers per day. The manager is…
A: Note- As per our policy we can answer only the first 3 sub-parts of a question. If you want…
Q: Give an example of a small set of dara for ehich the mean is larger than the third quartile
A:
Q: The number of points held by a sample of the NHL’s highest scorers for both the Eastern Conference…
A: State the hypotheses.
Q: Starbuck’s 2019 Annual Report shows that the Approximate sizes in Square Feet of the properties for…
A: 1.) Here, we have observations on 7 locations, x1,x2,...,x7. Then, the average size of 7 location is…
Q: can be considered as the mid point of the distribution. Select one: a. mode b. none of these C. mean…
A: Median = Middle number of the sorted data. Mean = Sum of all observation / total number of…
Q: Before the furniture store began its ad campaign, it averaged 123 customers per day. The manager is…
A: Note- As per our policy we can answer only the first 3 sub-parts of a question. If you want…
Q: The number of points held by a sample of the NHL’s highest scorers for both the Eastern Conference…
A: State the hypotheses.
Q: The number of points held by a sample of the NHL's highest scorers for both the Eastem Conference…
A: Eastern Conference (X) Western Conference (Y) (x-xbar)^2 (y-ybar)^2 83 77 211.5702 281.4938 60…
Q: Which measure of central tendency better describes the weight of the candy? The mean weight is x =]…
A: The descriptive analysis is conducted using EXCEL. The software procedure is given below: Enter the…
Q: A. Compute the percentiles of the following areas using the standard normal table, then illustrate…
A:
Q: A factory for the production of light bulbs took a random sample of 200 units and found that 18 of…
A: Statistical Laboratory: The calculation of the statistical measures can be known as the statistical…
Q: How does the shape of a t-distribution compare with the normal distribution? How does the shape of a…
A: The t-distribution has more scores in its tails than the normal distribution It is slightly…
Q: Find the proportion of Normally distributed observations with a z-score above -1.93. Give your…
A:
Q: The average number of cavities that thirty-year-old Americans have had in their lifetimes is 5. Do…
A: Given data is3,4,4,4,5,5,6,4,5,4,3,5,6,5,3from given data n=15x=4.4s=0.9856α=0.05
Q: A survey of 2255 randomly selected US adults found that 51% said they know all or most o their…
A: Given: n=2255p=0.5190% CI for p=?α=1-0.90=0.10zα2=z0.05=1.645 (z-table)
Q: Say we have a dataset consisting of 20 observations. From the observations and their corresponding…
A: Here, There are 20 observations given, and the correlation coefficient is equal to 0.89. The…
Q: The two data sets below represent the high temperatures in two citieseach day for 5 days.City A:…
A: Given the data City A: 18°F, 44°F, 52°F, 55°F, 58°F, 56°F City B: 15°F, 41°F, 63°F, 61°F, 57°F, 60°F
Q: Based on the histogram, which rule is more appropriate for describing the distribution of the RDER…
A: Given: The data given is N 71 MEAN 78.18851 STD DEV 63.24291 MINIMUM -19.271 MAXIMUM…
Q: Find Pas, that is find 90 percentile of z-score from the standard normal distribution. 6.
A:
Q: he credit card payment, PaymentAmt, made last month by 100 credit card holders was obtained and…
A: Given that - he credit card payment, PaymentAmt, made last month by 100 credit card holders was…

Step by step
Solved in 4 steps with 4 images
