quency is 15. 
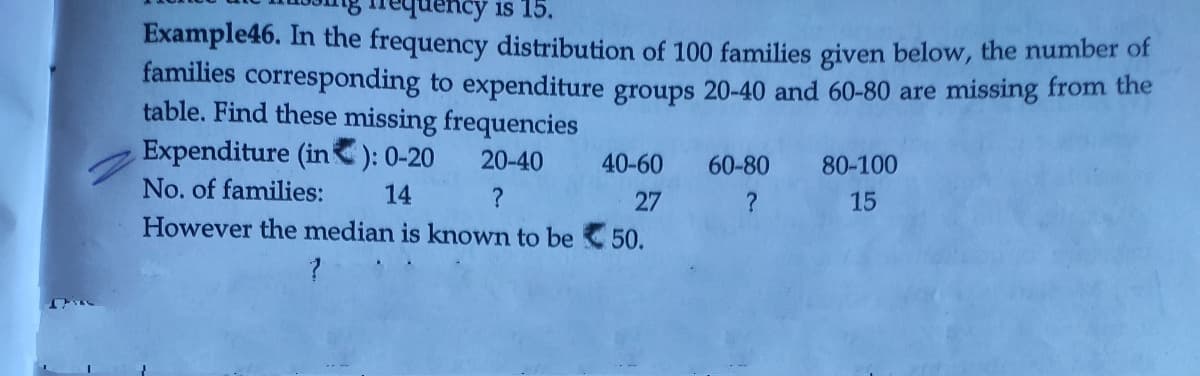
Example46. In the frequency distribution of 100 families given below, the number of families corresponding to expenditure groups 20-40 and 60-80 are missing from the table. Find these missing frequencies Expenditure (in ): 0-20 20-40 40-60 60-80 80-100 No. of families: 14 27 However the median is known to be 50. 15
Q: A. Should the researcher conclude that there is a significant relation between birth order and…
A: A. The test is that there is a significant relation between birth order and personality or not. The…
Q: 4.6 4.6 4.4 4.5 4.3 4.7 49 4.6 4.6 4.6 4.5 4.7 4.5 4.5 4.6 4.6 4.6 4.8 1. Use the ungrouped data…
A: Hi! Thank you for the question, As per the honor code, we are allowed to answer three sub-parts at a…
Q: 17 A professor had students keep track of their social interactions for a week. The number of…
A: 17. The number of students had at least 60 social interactions for the week is obtained below: From…
Q: Q6. Construct a frequency and cumulative relative frequency distribution using the bill data of male…
A: Given: Data 0 0 0 5 15 16 18 20 20 20 20 20 20 20 23 25 25…
Q: 5. The frequency distribution shown in the figure lists the annual salaries of the managers at…
A: 5. Procedure to construct histogram: The x-axis represents the Salaries. The y-axis represents the…
Q: Protein Grams in Fast Food The amount of protein (in grams) in a variety of fast-food sandwiches is…
A:
Q: The accompanying relative frequency distribution represents the last year car sales for the sales…
A:
Q: Identify the lower class limits, upper class limits, class width, class midpoints, and class…
A: A) The lower class limits are as follows: Lower Class limits 5 15 25 35 45…
Q: A professor had students keep track of their social interactions for a week. The number of social…
A: Given data,
Q: the lower class limits, upper class limits, class width, class midpoints, and class boundaries for…
A:
Q: A researcher is interested in the relationship between birth order and personality. A sample of n =…
A: Hi! Thank you for the question, As per the honor code, we are allowed to answer one question at a…
Q: A researcher gathered data on hours of video games played by school-aged children and young adults.…
A: (a) Obtain the frequency distribution for the given data. The frequency distribution for the given…
Q: corresponding to expenditure groups 20-40 and 60-80 are missing from the table. However, the median…
A: Expenditure No. of families Cumulative frequency 0-20 14 14 20-40 f1 14+f1 40-60 27 41+f1…
Q: A researcher gathered data on hours of video games played by school-aged children and young adults.…
A: Arranging the data in ascending order: 2, 2, 3, 4, 4, 4, 4, 5, 5, 5, 6, 7, 7, 7, 8, 9, 9, 9, 9, 9,…
Q: Thomas is running an after-school day care center with 8 children. He is thinking about providing…
A: Thomas is running an after-school day care centre with 8 children. "P" represents a passed class,…
Q: The following table shows the distribution of the lengths of hospital stays recorded by a random…
A: a) Relative frequency: The general formula to obtain relative frequency is given below: Relative…
Q: rotein Grams in Fast Food The amount of protein (in grams) in a variety of fast-food sandwiches is…
A: Solution-: We want to find the class width for frequency distribution with 8 classes?
Q: Pupils Per Teacher The average number of pupils per teacher in certain states is shown. 24 21 16 149…
A:
Q: 4. In the frequency distribution of 100 families given below the number of families corresponding to…
A:
Q: A survey of adult men and women asked, "Which one of the following jobs would you most like to…
A: The relative frequency is simply given by rf = (favorable frequency)/(total frequency) Job Men…
Q: Suppose a survey of adults and teens (ages 12-17) in a certain country was conducted to determine…
A: “Since you have posted a question with multiple sub-parts, we will solve first three subparts for…
Q: In a population of 20 families, the number of cars owned by each family is given below: 0, 2, 2, 3,…
A: Data given 0, 2, 2, 3, 1, 1, 4, 2, 4, 5, 1, 3, 6, 1, 2, 4, 3, 2, 3, 3 Note: According to Bartleby…
Q: Below is the frequency distribution table of the Mathematics test scores of 50 students. What…
A: Scores Frequency 46 -50 4 41-45 8 36-40 11 31-35 9 26-30 12 21-25 6
Q: Find frequency histogram, frequency polygon, frequency Cumulative Curve ( less than) and percentage…
A:
Q: A professor had students keep track of their social interactions for a week. The number of social…
A: Frequency is the number of students involved in a corresponding class. Therefore total number of…
Q: 31 In the frequency distribution of 100 families given below, the aumber of families corresponding…
A: The median is the middle value, which split the entire data into two equal halves. The median for…
Q: Pupils Per Teacher The average number of pupils per teacher in certain states is shown. 24 14 18 23…
A: The average number of pupils per teacher in a certain states is shown as follows. 24 14 18 23 27…
Q: Given the following frequency table, in which one of the following class intervals the median and…
A: We have to find in which class median and mode will be.
Q: In the frequency distribution of 100 families given below, the number of families corresponding to…
A:
Q: 1- Ages of the Vice Presidents at the Time of Their Death The ages of the Vice Presidents of the…
A: As per guidelines, we will only solve first question, please repost other questions for more…
Q: A researcher gathered data on hours of video games played by school-aged children and young adults.…
A: Class data 0 - 2 0,1,1,0,2,0,1,0,1,1,2 3 - 5…
Q: A survey of adult men and women asked, "Which one of the following jobs would you most like to…
A:
Q: Suppose a survey of adults and teens (ages 12-17) in a certain country was conducted to determine…
A: Data is given For adults and Teens according to number of texts We have to calculate frequency…
Q: (fo-fe) Fill in the missing values in the table. Round your responses for the expected frequencies…
A: Does it seem to you that people tend to be absent more on some days of the week than on others First…
Q: 2- The ages of the Vice Presidents of the United States at the time of their death are listed below.…
A:
Q: Use the relative frequency distribution in the table below to determine the following. (See Example…
A: The relative frequency table is given as follows: Download time (in seconds) Percent of…
Q: 55 30 50 15 2 Speed of Highway Drivers 60 50 40 30 20 10 50 55 60 65 70 75 80 85 Speed (in mph) a.…
A: The graph of number of drivers against speed is given.
Q: A professor had students keep track of their social interactions for a week. The number of social…
A: Given A tabular colum containing data of social interaction for a week.we need to determine the…
Q: 8. Find the Men, Mode and Median for A) the given frequency distribution table 6. 10 4. 3. 1
A:
Q: Find frequency histogram, frequency polygon, frequency Cumulative Curve ( less than) and percentage…
A:
Q: Mr. Akram handles his own investment and has done for so many years. Listed below is the holding…
A: The given data is, 8 8 6 11 11 9 8 5 11 4 8 5 14 7 12 8 6 11…
Q: a) Construct a Frequency Distribution table using the aforementioned data using 5 classes b)…
A: Given Data : Minimum = 3 Maximum = 32 Number of classes = 5 Minimum Class Width≥max−minNo.…
Q: Question: The following data represents the number of cattles in a some pastures. Construct a…
A:
Q: Which one of the following can be taken as frequency while calculating median for the grouped data?…
A: median: A second measure of location that may beused to describe the center or middle of a set of…
Q: Example Obtain the median for the following frequency distribution : 6 x: 1 2 3 4 7 8 9. f: 8 10 11…
A:
Q: 2.27 Textbook Prices The table shows prices of 50 college textbooks in a community college…
A: The objective is to make an appropriate graph of the distribution of data, pose a statistical…
Q: Below is the frequency distribution table of the Mathematics test scores of 50 students. What…
A: Given Information: Scores Frequency 46-50 4 41-45 8 36-40 11 31-35 9 26-30 12 21-25 6
Q: 28. Below is a frequency distribution table of the number of naps that mothers give their children…
A: Since you have asked multiple question, we will solve the first question for you. If you want any…
Q: 4.6 4.6 4.4 4.5 4.3 4.7 4.9 4.6 4.6 4.6 4.5 4.7 4.5 4.5 4.6 4.6 4.6 4.8 1. Use the ungrouped data…
A:
Q: 4.6 4.6 4.4 4.5 4.3 4.7 4.9 4.6 4.6 4.6 4.5 4.7 4.5 4.5 4.6 4.6 4.6 4.8 1. Use the ungrouped data…
A: Answer:Given that here, the ungrouped data We have to arrange the data into class interval a.…
Step by step
Solved in 2 steps with 2 images
- Which of the following is not an example of a surveyAn insurance investigator has observed that people with some astrological signs tend to be safer drivers than people with other signs. Using insurance records, the investigator classified 150 people according to their astrological signs and whether or not they were involved in a car accident during the previous 12 months. Do the following data indicate a significant relationship between sign and accidents? Test with a = .05. Libra Leo Gemini Accident 7 4 19 No Accident 73 46 1