Question 1 (. 
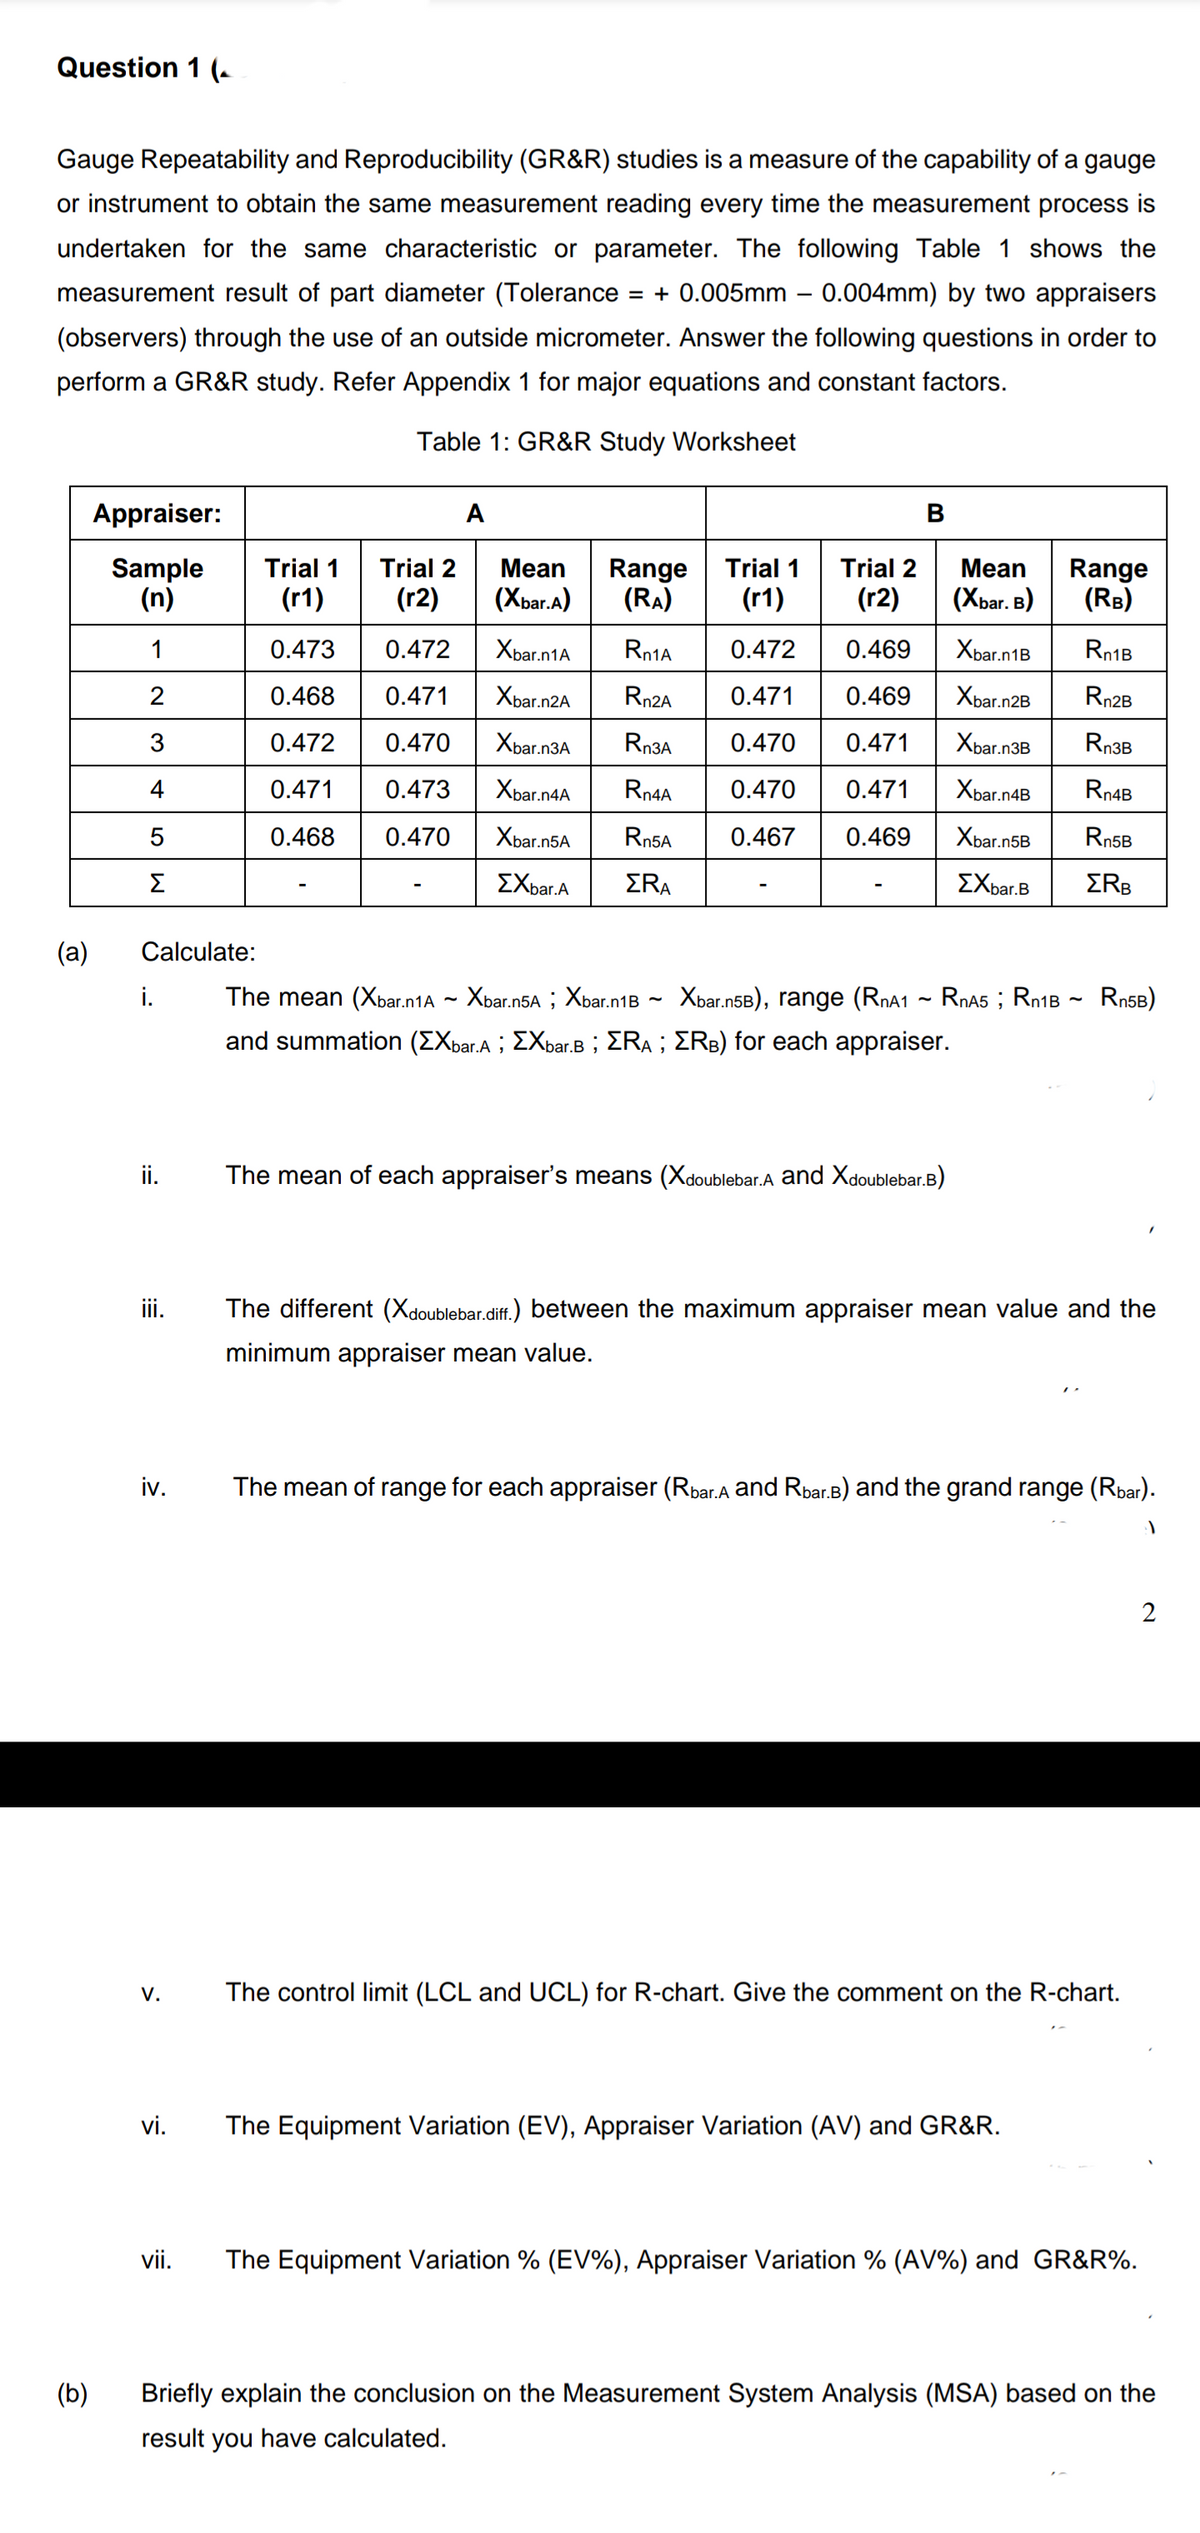
Gauge Repeatability and Reproducibility (GR&R) studies is a measure of the capability of a gauge or instrument to obtain the same measurement reading every time the measurement process is undertaken for the same characteristic or parameter. The following Table 1 shows the measurement result of part diameter (Tolerance = + 0.005mm – 0.004mm) by two appraisers (observers) through the use of an outside micrometer. Answer the following questions in order to perform a GR&R study. Refer Appendix 1 for major equations and constant factors.
Q: Find the critical value(s) and rejection region(s) for a right-tailed chi-square test with a samp...
A:
Q: (a) The area to the right of the endpoint on a N(50, 4.0) curve is about 0.01. Round your answer to ...
A:
Q: 18. For the following scores, find the value of cach expression: a. ΣΧ b. Σχ? c. (EX)² d. 2(X – 1) 4...
A: HERE Given Value of X are 4,2,1,5
Q: Construct simple average price relative index number using arithmetic mean for the year 2012 for the...
A:
Q: According to an almanac, 70% of adult smokers started smoking before turning 18 years old. (a) Compu...
A:
Q: Determine what the key terms refer to in the following study a fitness center is interested in the m...
A: key terms refer to in the following study
Q: probability that a randomly selected dropout is white, given that he or she is 16 to 17 years old? T...
A:
Q: A population distribution is normally distributed with μ = 182 and σ= 35. Use this information to de...
A: Give μ = 182 and σ= 35 Note: This probability value calculated from standard normal distribution t...
Q: Topic: Normal Distribution Please show correct solution. 1. A vegetable distributor knows tha...
A: Given:
Q: The concentration of alcohol in a brand of cough syrup is assumed to be normally distributed with me...
A:
Q: Prose rhythm is characterized as the occurrence of five-syllable sequences in long passages of text....
A: Let p be the population proportion p=26.1%, X=62, n=320
Q: Can a critical value for the χ2-test be negative? Explain
A: χ2-test is used when we want see whether there is any significant difference between the expected f...
Q: Using the information provided below, calculate the confidence intervals for both Student B Mean: 5...
A:
Q: It is a level of measurement for categorical data, where numbers are assigned to non-numeric data
A: We know that there are four levels of measurement, two are used for categorical data amd two are use...
Q: -2 1 2 -2 -1 0 1 2 -2 -1 0 1 -1 0 Theoretical Quantiles ANOVA ANOVA - math Sum of Squares Mean Squar...
A: Given information: Sum of squares DF Mean square F P η2 Program 4002 2 2001.1 29.3 0.229 ...
Q: A random sample of 20 binomial trials resulted in 9 successes. Test the claim that the population pr...
A:
Q: From the data given below find the missing frequency. If the arithmetic mean is 28, find the median ...
A:
Q: 2. Given a normally distributed population with μ = 110 and σ = 20, if samples of size 100 are drawn...
A: Sampling distribution of (x¯): If simple random sample of size n is drawn from Normal population wit...
Q: For the following question: 1) state your hypotheses 2) find the critical z-scores 3 (this step is o...
A: Sample sizes n1=250 , n2=185 Sample means X̄1=2.31 , X̄2=2.65 ?1 =1.2 ...
Q: The following data were collected by counting the number of operating rooms in use at RTM hospital o...
A: Let r.v. X denote the no. of operating rooms in the hospital being used. total no. of operating room...
Q: coded as -N/N, N/N2. (a) Show that the LDA rule classifies to class 2 if "i-"(i2 - in) > £-'-TEn + l...
A:
Q: Let X be a continuous random variable that is normally distributed with mean, µ = 15 and standard de...
A:
Q: For the following question EITHER state the critical values and use the critical values/z-obtained c...
A:
Q: In a study of 349,212 cell phone users, it was found that 26 developed cancer of the brain of hervou...
A:
Q: Use n= 10 and p = 0.7 to complete parts (a) through (d) below. .... (a) Construct a binomial probabi...
A: Given,n=10p=0.7q=1-p=1-0.7=0.3A random variable X~Binomial(n=10 ,p=0.7)P(X=x)=10x0.7x0.310-x ; x=0...
Q: Mr. Ahmed, manager of the Bara Gali Hotel, is considering how to restructure the front desk to reach...
A: Given: Mr. Ahmed, manager of the Bara Gali Hotel, is considering how to restructure the front desk t...
Q: According to an airline, flights on a certain route are on time 80% of the time. Suppose 10 flights ...
A:
Q: A large midwestern public university admits students into its MBA program based on, among other crit...
A: Hi! Thank you for the question, As per the honor code, we are allowed to answer three sub-parts at a...
Q: Owner-Occupied Housing Units In the US Census, we learn that 65 % of all housing units are owner-occ...
A:
Q: Question 5. Select the correct answer that fills in the blanks in the order they appear in the sente...
A: We have given that In a Latin squares design model, the statistical test focuses on comparing the le...
Q: Use the sample information = 41, 0= 4, n= 20 to calculate the following confidence intervals for u a...
A: Given Mean(x)=41standard deviation(σ)=4sample size(n)=20
Q: The table summarizes a random sample of 3600 college students who were classified according to GPA a...
A:
Q: Adele Enterprises is exploring a new service to provide weekly delivery of grocery items to homes in...
A:
Q: 1. IQ Scores Listed below are the IQ scores of randomly selected statistics professors. What value i...
A: 1. Mean: Mean is the expected value of a set of observations. In other words, mean is he average of ...
Q: The naval base would like to model the projected percentage increase y in fleet effectiveness by the...
A: Given: The naval base would like to model the projected percentage increase y in fleet effectiveness...
Q: Suppose normally distributed weight measurements (in ounces) for 60 randomly se- lected major league...
A: Solution: Given information: n= 60 Sample size ∑i=160Xi=312.7∑i=160Xi2=1629.9396x=∑i=160Xin=312.760...
Q: A survey to find out if families living in a certain municipality are in favor of No mask No entry w...
A: Given: Strata: class A, class B, class C No. of Families (N)
Q: Owner-Occupied Household Size The table below gives the probability function for the random variable...
A:
Q: Given the population size with a corresponding margin of error, determine the sample size of each of...
A:
Q: According to an airline, flights on a certain route are on time 80% of the time. Suppose 10 flights ...
A: Given that, according to an airline, flights on certain routes are on time 80% of the time. 10 flig...
Q: The relative risk and odds ratio estimates based on the same data will agree in terms of the directi...
A: 1. True 2. False
Q: (a) Listening to news, suppose you suddenly learn about Omicron outbreak in your area and taking pre...
A: For the given questions, we neen to answer following: - (a).The type II error. (b). The lowest score...
Q: Question Three a) A manufacturer of apple phone charges claims that only 4% of his production is def...
A: Below the attachment
Q: Baking Soda (tsp) Circumference (ave) 14.1inch 11.1nch 3 10.9inch 4 6 1inch 5. 1.6inch 6. 0.6inch 2....
A: Solution-: Let, X-Baking Soda (lsp) and Y=Circumference (ave) (inch) Create a scatter plot for the ...
Q: Construct a control chart for the proportion of defectives obtained in repeated random samples of si...
A: Given : Sample size(n) =100 Defective proportion (p) =0.20
Q: Let Zlx) ~N(0,1) prop (x1.21) = %3D prop
A: Let X be the random variable from standard normal distribution with mean = 0 and standard deviation ...
Q: The following data were collected by counting the number of operating rooms in use at RTM hospital o...
A: Let r.v. X denote the no. of operating rooms in the hospital being used. total no. of operating room...
Q: Telelvision Newspaper Adveritising Adveritising ($1000) 60 Develop an estimated regression equation ...
A: *Answer:
Q: Question 8 Suppose that the average number of Facebook friends users have is normally distributed wi...
A: Given : Population Mean,μ = 147 Population Standard Deviation,σ = 54 sample size,n...
Q: FIND THE MEAN NUMBER OF PLANTS THAT HAVE GREEN PODS. B) FIND THE VARIANCE OF THE NUMBER OF PLANT...
A: Let p be the probability of having green pods. Given that p = 0.65 Let X denote the number of plants...
Trending now
This is a popular solution!
Step by step
Solved in 4 steps
- Repeat Example 5 when microphone A receives the sound 4 seconds before microphone B.QUESTION 4 Determine whether the given percentage is a statistic or a parameter and why. In a study of all 1018 students at Guttman, data showed that 10% live in Queens. a. Parameter because the value is a numerical measurement describing a characteristic of a sample. b. Statistic because the value is a numerical measurement describing a characteristic of a sample. c. Parameter because the value is a numerical measurement describing a characteristic of a population. d. Statistic because the value is a numerical measurement describing a characteristic of a population.QUESTION 25 A clinical trial is being conducted in order to determine the efficacy of a new drug used to treat Rheumatoid arthritis. The efficacy of the medication will not only be determined by the physical improvement of symptoms but also by using a blood test to examine the concentration C-reactive protein (an inflammatory marker) in an individual’s blood. If the researcher wants a margin of error for the level of C-reactive protein to be less than or equal to 3.0 mg/dL, and if the standard deviation for C-reactive protein concentrations among arthritis patients was previously documented at 8 mg/dL, how many patients should be recruited for each group in the study assuming a 95% confidence interval will be used to quantify the mean differences between the control group and the treatment group? nfor the treatment group = 112; n for the control group = 111 nfor the treatment group = 56; n for the control group = 57 nfor the treatment group = 55; n…
- question 4 Chen et al. (2000) examined the foraging behaviour of northern elephant seals (Mirounga angustirostris) that breed along the west coast of Mexico and the USA. They attached platform satellite transmitter terminals (PTTs) to 22 male seals and recorded, for each seal, the distance (km) to its main feeding area offshore and the amount of time (days) it spent at the feeding area. The results are presented below: What two null hypotheses are being tested with the output shown above? What statistical conclusions would you draw about these hypotheses? Complete the regression equation by filling in the blanks (to the nearest 3 decimal places). duration = + * distance What is one biological interpretation of this relationship between duration and distance ? What % of the variation in duration at main feeding area was explained by distance to feeding area?Question 8In a particular river, a certain micro-organism occurs at an average rate of 10 per mililitre.A random sample of 0.5 litres of water is taken from a nearby stream and is found tocontain 3478 micro-organisms. Does this provide significant evidence, at the 5% level, ofa difference in the incidence of the micro-organisms between the stream and the river?question (9): A researcher was interested in the effect of job security on stress. The researcher recruited a random sample of 10 individuals who had job security and 10 individuals who were employed on a 1 year contract. The researcher measured the stress hormone through a saliva sample. This is an independent sample design; TRUE OR FALSE
- Question 3 The records of a state-owned company indicate that of all vehicles undergoing emissions testing during the previous year, 70% passed on the first test. A random sample of 200 cars tested in the country during the current year reveals that 62% passed the initial test. Does this data suggest that the true proportion for this country is less than the previous countrywide proportion? Test the relevant hypothesis at the 5% level of significance. (a) State the null and alternative hypotheses for the test. (b) What is the test statistic? (c) Calculate the value of the test statistic for this test. (d) Determine the critical region(s) for this test. (e) State the conclusion of this test. Give a reason for your answer.QUESTION 12 Historically, the proportion of people who trade in their old car to a car dealer when purchasing a new car is 48%. Over the previous 6 months, in a sample of 115 new-car buyers, 46 have traded in their old car. To determine (at the 10% level of significance) whether the proportion of new-car buyers that trade in their old car has statistically significantly decreased, what can you conclude concerning the null hypothesis? Reject the null hypothesis Fail to reject the null hypothesisQuestion 1 (d) A standard method for determination of the carbon monoxide (CO) level in gaseous mixtures is known from many hundreds of measurements to have a standard deviation of 0.21 ppm CO. A moderation of the method yields a value for s of 0.15 ppm CO for pooled data set with 12 degrees of freedom. A second moderation, also based on 12 degrees of freedom, has a standard deviation of 0.12 ppm CO. Is either modification significantly more precise than the original?
- Question 24: The US Department of Energy reported that 52% of homes were heated by natural gas. A random sample of 311 homes in Oregon found that 141 were heated by natural gas. Test the claim that proportion of homes in Oregon that were heated by natural gas is different than what was reported. Use a 5% significance level. Give answer to at least 4 decimal places. What are the correct hypotheses? (Select the correct symbols and use decimal values not percentages.) H0: H1: Based on the hypotheses, compute the following:Test Statistic = p-value = Based on the above we choose to The correct summary would be: that the proportion of homes in Oregon that were heated by natural gas is different than what the DOE reported value of 52%.Question 3 A humane society claims that less than 61% of households in a certain country own a pet. In a random sample of 500 households in that country, 285 say they own a pet. At α=0.05, is there enough evidence to support the society's claim? Complete parts (a) through (c) below. (a) Identify the claim and state H0 and Ha. (b) Identify the standardized test statistic first then use technology to find the P-value. (c) Decide whether to reject or fail to reject the null hypothesis and (d) interpret the decision in the context of the original claim.Question 1 The average age in a sample of 190 students at City College is 22. As a result of this sample, it can be concluded that the average age of all the students at City College Question 1 options: must be more than 22, since the population is always larger than the sample is 22 since the sample mean is an unbiased estimator of the population mean could be larger, smaller, or equal to 22 must be less than 22, since the sample is only a part of the population