Question 1 Consider the charts below. Discuss them carefully and explain how the empirical relationship between M1 growth and inflation in the charts relates to the theoretical relationship between money and inflation? Is the empirical relationship consistent with the theoretical relationship? If so, how so? If not, why not? 201 15 10 5 0 30 25 20 15 5 0961 -15 1960 1965 1970- 1975- 1980- 1985- 1990- 1995- United States 1965 1970- الله الله الله ال 2000- 2005- 2010- -M1 growth-Inflation Australia 40 2000- 2005- 2010- 30- 20- Sandrarifs Land 10- 0- -10- 30 25- 1960 20- 15 10 5 0 1965 1970 1975 1980- 1985 1990- 1995 -M1 growth-Inflation 2000 1960 1965- 1970- 1975 1980- 1985 Switzerland Whyn 0661 2005 2010 Canada ww 1995 2000- 2005 2010- M1 growth-Inflation -M1 growth-Inflation Note: Money growth is measured by the growth rate of M1. Inflation is measured by the growth rate of the consumer price index. Source: OECD Economic Outlook, OECD, 19 April 2012, http://www.oecd-ilibrary.org/statistics.
Question 1 Consider the charts below. Discuss them carefully and explain how the empirical relationship between M1 growth and inflation in the charts relates to the theoretical relationship between money and inflation? Is the empirical relationship consistent with the theoretical relationship? If so, how so? If not, why not? 201 15 10 5 0 30 25 20 15 5 0961 -15 1960 1965 1970- 1975- 1980- 1985- 1990- 1995- United States 1965 1970- الله الله الله ال 2000- 2005- 2010- -M1 growth-Inflation Australia 40 2000- 2005- 2010- 30- 20- Sandrarifs Land 10- 0- -10- 30 25- 1960 20- 15 10 5 0 1965 1970 1975 1980- 1985 1990- 1995 -M1 growth-Inflation 2000 1960 1965- 1970- 1975 1980- 1985 Switzerland Whyn 0661 2005 2010 Canada ww 1995 2000- 2005 2010- M1 growth-Inflation -M1 growth-Inflation Note: Money growth is measured by the growth rate of M1. Inflation is measured by the growth rate of the consumer price index. Source: OECD Economic Outlook, OECD, 19 April 2012, http://www.oecd-ilibrary.org/statistics.

Chapter27: Issues In Macroeconomic Theory And Policy
Section: Chapter Questions
Problem 6P

Related questions
Question
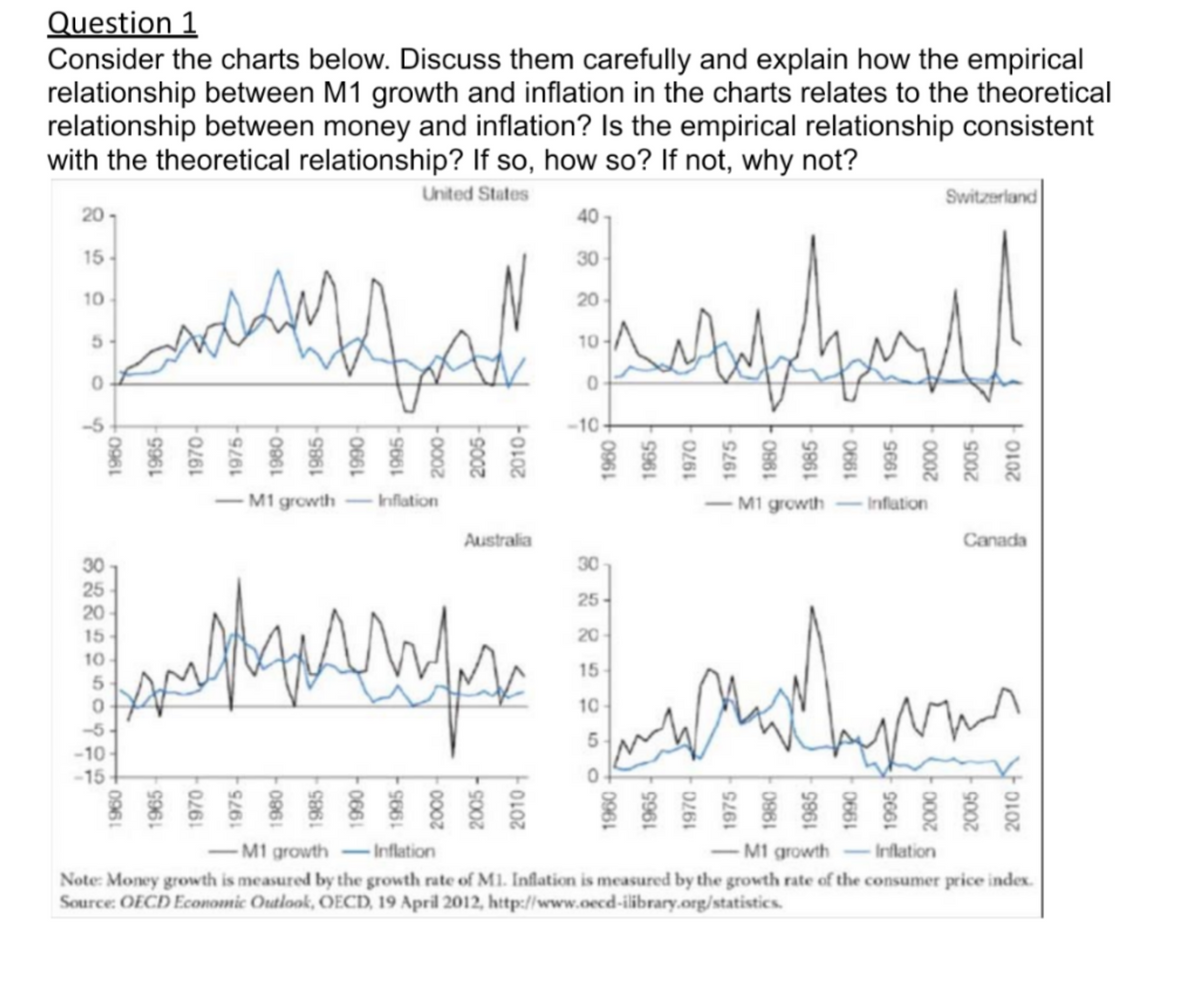
Transcribed Image Text:Question 1
Consider the charts below. Discuss them carefully and explain how the empirical
relationship between M1 growth and inflation in the charts relates to the theoretical
relationship between money and inflation? Is the empirical relationship consistent
with the theoretical relationship? If so, how so? If not, why not?
United States
maleford wordband!
20-
15
10
0
30
25
20
15
10
5
0
0961
-10
-15
1965-
1970-
1975-
1960
1965
1970
1980-
1985-
1975-
| 1990
1995
M1 growth-Inflation
1980-
1985
2000-
2005-
2010-
0661
Infs Landly
1995
Australia
2000
2005-
40
2010-
30
20
10
0
-10-
30
25
20
15
1960
10
5
1970
1960
M1 growth
1965
1970
-Inflation
Switzerland
2005
2010
Canada
2010
-M1 growth-Inflation
-M1 growth - Inflation
Note: Money growth is measured by the growth rate of M1. Inflation is measured by the growth rate of the consumer price index.
Source: OECD Economic Outlook, OECD, 19 April 2012, http://www.oecd-ilibrary.org/statistics.
Expert Solution
This question has been solved!
Explore an expertly crafted, step-by-step solution for a thorough understanding of key concepts.

Step by step
Solved in 3 steps

Knowledge Booster


Learn more about
Need a deep-dive on the concept behind this application? Look no further. Learn more about this topic, economics and related others by exploring similar questions and additional content below.Recommended textbooks for you
Exploring Economics
Economics
ISBN:
9781544336329
Author:
Robert L. Sexton
Publisher:
SAGE Publications, Inc

Brief Principles of Macroeconomics (MindTap Cours…
Economics
ISBN:
9781337091985
Author:
N. Gregory Mankiw
Publisher:
Cengage Learning
Exploring Economics
Economics
ISBN:
9781544336329
Author:
Robert L. Sexton
Publisher:
SAGE Publications, Inc
Brief Principles of Macroeconomics (MindTap Cours…
Economics
ISBN:
9781337091985
Author:
N. Gregory Mankiw
Publisher:
Cengage Learning