QUESTION 1: Fifty women were asked which of the following gift items they prefer as a birthday present, whether: clothing (C), jewelry (J), perfume (P), handbag (H) or shoes (S). Their responses are listed in the data set below. J J P H J P C P P C J J JC P C H P J H J J J C J S P J P P H J H S P C P C J J S JC 1. Prepare a frequency distribution table. 2. Calculate the relative frequencies and percentages for all the categories. 3. Construct one graph to represent the frequency and another to represent the percentage frequency distribution. J C P J J CJ
QUESTION 1: Fifty women were asked which of the following gift items they prefer as a birthday present, whether: clothing (C), jewelry (J), perfume (P), handbag (H) or shoes (S). Their responses are listed in the data set below. J J P H J P C P P C J J JC P C H P J H J J J C J S P J P P H J H S P C P C J J S JC 1. Prepare a frequency distribution table. 2. Calculate the relative frequencies and percentages for all the categories. 3. Construct one graph to represent the frequency and another to represent the percentage frequency distribution. J C P J J CJ

Functions and Change: A Modeling Approach to College Algebra (MindTap Course List)
6th Edition
ISBN:9781337111348
Author:Bruce Crauder, Benny Evans, Alan Noell
Publisher:Bruce Crauder, Benny Evans, Alan Noell
Chapter5: A Survey Of Other Common Functions
Section5.3: Modeling Data With Power Functions
Problem 6E: Urban Travel Times Population of cities and driving times are related, as shown in the accompanying...

Related questions
Question
100%
Quantitative Methods I - Q1
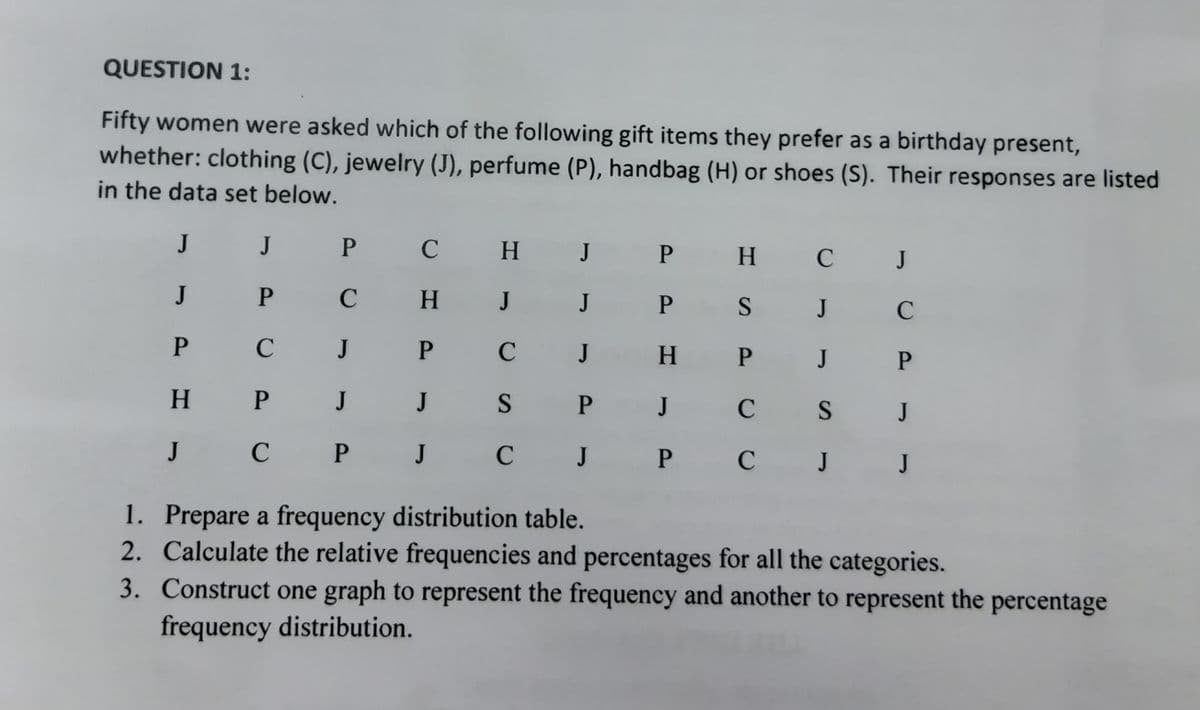
Transcribed Image Text:QUESTION 1:
Fifty women were asked which of the following gift items they prefer as a birthday present,
whether: clothing (C), jewelry (J), perfume (P), handbag (H) or shoes (S). Their responses are listed
in the data set below.
J
JP
J
P
CH J
P CH J J
C
J
S
CJP
PJJ
J C P J
HP J
PH
PS
H P
C
PJ
CJP
C J
J
C
J P
S
J
J
CJ
1. Prepare a frequency distribution table.
2. Calculate the relative frequencies and percentages for all the categories.
3. Construct one graph to represent the frequency and another to represent the percentage
frequency distribution.
Expert Solution
This question has been solved!
Explore an expertly crafted, step-by-step solution for a thorough understanding of key concepts.

This is a popular solution!

Trending now
This is a popular solution!

Step by step
Solved in 3 steps with 2 images

Recommended textbooks for you
Functions and Change: A Modeling Approach to Coll…
Algebra
ISBN:
9781337111348
Author:
Bruce Crauder, Benny Evans, Alan Noell
Publisher:
Cengage Learning

Glencoe Algebra 1, Student Edition, 9780079039897…
Algebra
ISBN:
9780079039897
Author:
Carter
Publisher:
McGraw Hill
Functions and Change: A Modeling Approach to Coll…
Algebra
ISBN:
9781337111348
Author:
Bruce Crauder, Benny Evans, Alan Noell
Publisher:
Cengage Learning
Glencoe Algebra 1, Student Edition, 9780079039897…
Algebra
ISBN:
9780079039897
Author:
Carter
Publisher:
McGraw Hill