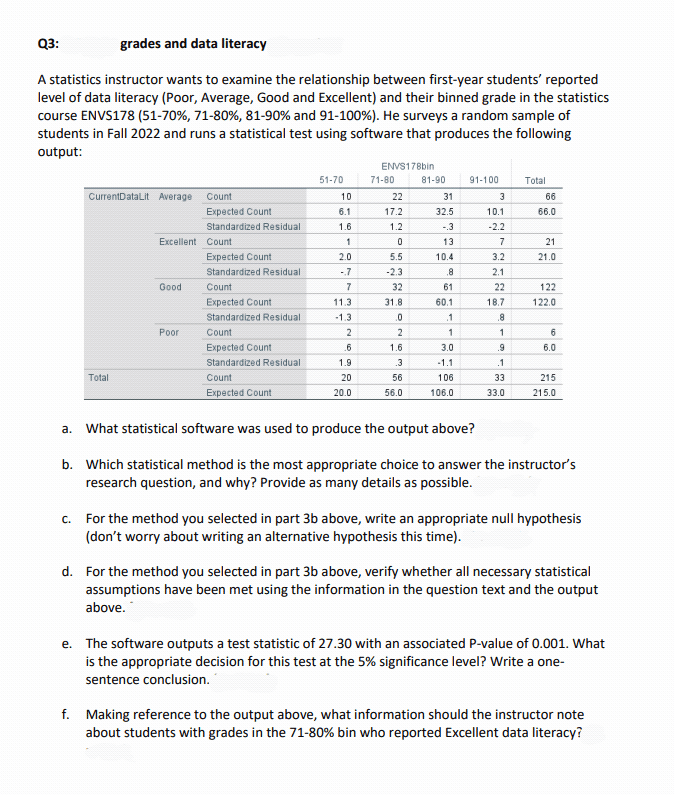
Q3: grades and data literacy A statistics instructor wants to examine the relationship between first-year students' reported level of data literacy (Poor, Average, Good and Excellent) and their binned grade in the statistics course ENVS178 (51-70%, 71-80 %, 81-90 % and 91-100% ) . He surveys a random sample of students in Fall 2022 and runs a statistical test using software that produces the following output: CurrentDataLit Average Count Total Excellent Count Good Expected Count Standardized Residual Poor Expected Count Standardized Residual Count Expected Count Standardized Residual Count Expected Count Standardized Residual Count Expected Count 51-70 10 6.1 1.6 1 2.0 -.7 7 11.3 2 .6 1.9 20 20.0 ENVS178bin 71-80 22 17.2 1.2 0 5.5 -2.3 32 31.8 .0 2 1.6 .3 56 56.0 81-90 31 32.5 13 10.4 .8 61 60.1 1 1 3.0 106 106.0 91-100 3 10.1 -2.2 7 3.2 2.1 22 18.7 .8 1 .9 .1 33 33.0 Total 66 66.0 21 21.0 122 122.0 6 6.0 215 215.0 a. What statistical software was used to produce the output above? b. Which statistical method is the most appropriate choice to answer the instructor's research question, and why? Provide as many details as possible. c. For the method you selected in part 3b above, write an appropriate null hypothesis (don't worry about writing an alternative hypothesis this time). d. For the method you selected in part 3b above, verify whether all necessary statistical assumptions have been met using the information in the question text and the output above. e. The software outputs a test statistic of 27.30 with an associated P-value of 0.001. What is the appropriate decision for this test at the 5% significance level? Write a one- sentence conclusion. f. Making reference to the output above, what information should the instructor note about students with grades in the 71-80% bin who reported Excellent data literacy?
Q3: grades and data literacy A statistics instructor wants to examine the relationship between first-year students' reported level of data literacy (Poor, Average, Good and Excellent) and their binned grade in the statistics course ENVS178 (51-70%, 71-80 %, 81-90 % and 91-100% ) . He surveys a random sample of students in Fall 2022 and runs a statistical test using software that produces the following output: CurrentDataLit Average Count Total Excellent Count Good Expected Count Standardized Residual Poor Expected Count Standardized Residual Count Expected Count Standardized Residual Count Expected Count Standardized Residual Count Expected Count 51-70 10 6.1 1.6 1 2.0 -.7 7 11.3 2 .6 1.9 20 20.0 ENVS178bin 71-80 22 17.2 1.2 0 5.5 -2.3 32 31.8 .0 2 1.6 .3 56 56.0 81-90 31 32.5 13 10.4 .8 61 60.1 1 1 3.0 106 106.0 91-100 3 10.1 -2.2 7 3.2 2.1 22 18.7 .8 1 .9 .1 33 33.0 Total 66 66.0 21 21.0 122 122.0 6 6.0 215 215.0 a. What statistical software was used to produce the output above? b. Which statistical method is the most appropriate choice to answer the instructor's research question, and why? Provide as many details as possible. c. For the method you selected in part 3b above, write an appropriate null hypothesis (don't worry about writing an alternative hypothesis this time). d. For the method you selected in part 3b above, verify whether all necessary statistical assumptions have been met using the information in the question text and the output above. e. The software outputs a test statistic of 27.30 with an associated P-value of 0.001. What is the appropriate decision for this test at the 5% significance level? Write a one- sentence conclusion. f. Making reference to the output above, what information should the instructor note about students with grades in the 71-80% bin who reported Excellent data literacy?

College Algebra (MindTap Course List)
12th Edition
ISBN:9781305652231
Author:R. David Gustafson, Jeff Hughes
Publisher:R. David Gustafson, Jeff Hughes
Chapter8: Sequences, Series, And Probability
Section8.7: Probability
Problem 58E: What is meant by the sample space of an experiment?

Related questions
Question
Transcribed Image Text:Q3:
grades and data literacy
A statistics instructor wants to examine the relationship between first-year students' reported
level of data literacy (Poor, Average, Good and Excellent) and their binned grade in the statistics
course ENVS178 (51-70%, 71-80%, 81-90% and 91-100%). He surveys a random sample of
students in Fall 2022 and runs a statistical test using software that produces the following
output:
CurrentDataLit Average
Total
Excellent Count
Good
Count
Expected Count
Standardized Residual
Poor
Expected Count
Standardized Residual
Count
Expected Count
Standardized Residual
Count
Expected Count
Standardized Residual
Count
Expected Count
51-70
10
OF
6.1
1.6
1
2.0
-.7
7
11.3
-1.3
2
6
1.9
20
20.0
ENVS178bin
71-80
22
17.2
1.2
0
5.5
-2.3
25
32
31.8
.0
2
1.6
.3
56
56.0
81-90
31
32.5
-.3
13
10.4
.8
61
60.1
.1
1
3.0
-1.1
106
106.0
91-100
3
10.1
-2.2
7
3.2
2.1
22
18.7
.8
1
.9
.1
33
33.0
Total
66
66.0
21
21.0
122
122.0
6
6.0
215
215.0
a. What statistical software was used to produce the output above?
b. Which statistical method is the most appropriate choice to answer the instructor's
research question, and why? Provide as many details as possible.
c. For the method you selected in part 3b above, write an appropriate null hypothesis
(don't worry about writing an alternative hypothesis this time).
d. For the method you selected in part 3b above, verify whether all necessary statistical
assumptions have been met using the information in the question text and the output
above.
e. The software outputs a test statistic of 27.30 with an associated P-value of 0.001. What
is the appropriate decision for this test at the 5% significance level? Write a one-
sentence conclusion.
f. Making reference to the output above, what information should the instructor note
about students with grades in the 71-80% bin who reported Excellent data literacy?
Expert Solution
This question has been solved!
Explore an expertly crafted, step-by-step solution for a thorough understanding of key concepts.

Step by step
Solved in 7 steps

Recommended textbooks for you
College Algebra (MindTap Course List)
Algebra
ISBN:
9781305652231
Author:
R. David Gustafson, Jeff Hughes
Publisher:
Cengage Learning
College Algebra (MindTap Course List)
Algebra
ISBN:
9781305652231
Author:
R. David Gustafson, Jeff Hughes
Publisher:
Cengage Learning