QUESTION 9 Figure 1.1 N(0, 1) 0.45 0.4 б.35 0.3 0.25 0.2 0.15 0.1 95% confidence interval a/2 = 0.025 0.05 a/2 = 0.025 -3 3 -1.96 Zw2 = 1.96 In the graphic above, what is the mean and standard deviation of the distribution? (enter the two values separated by a comma)
QUESTION 9 Figure 1.1 N(0, 1) 0.45 0.4 б.35 0.3 0.25 0.2 0.15 0.1 95% confidence interval a/2 = 0.025 0.05 a/2 = 0.025 -3 3 -1.96 Zw2 = 1.96 In the graphic above, what is the mean and standard deviation of the distribution? (enter the two values separated by a comma)

Glencoe Algebra 1, Student Edition, 9780079039897, 0079039898, 2018
18th Edition
ISBN:9780079039897
Author:Carter
Publisher:Carter
Chapter10: Statistics
Section10.3: Measures Of Spread
Problem 26PFA

Related questions
Question
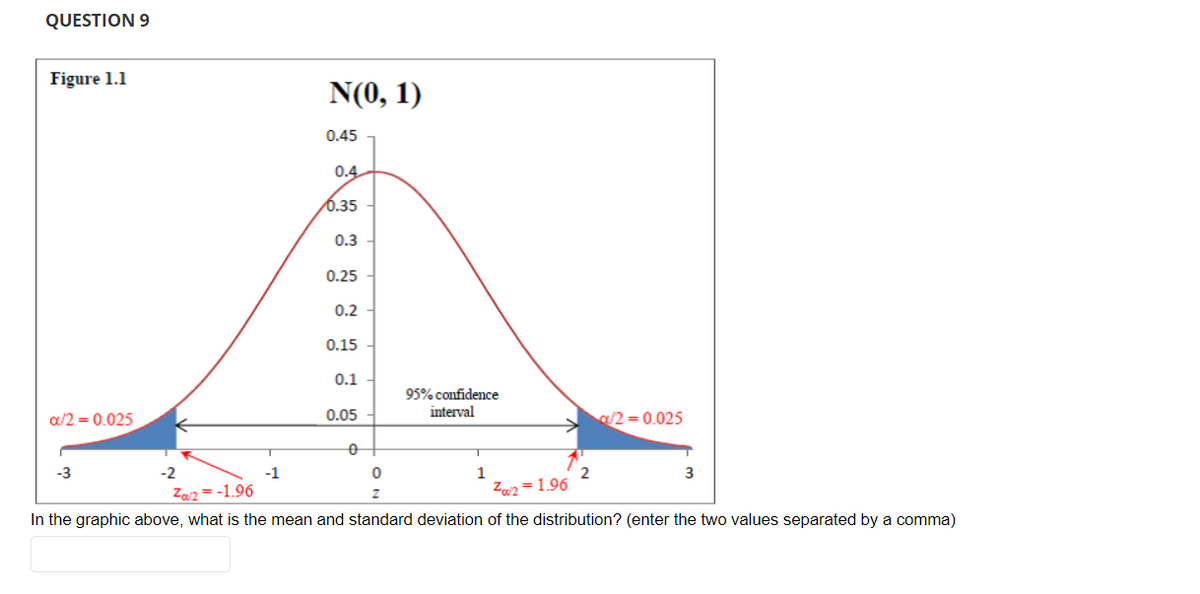
Transcribed Image Text:QUESTION 9
Figure 1.1
N(0, 1)
0.45
0.4
б.35
0.3
0.25
0.2
0.15
0.1
95% confidence
interval
a/2 = 0.025
0.05
a/2 = 0.025
-3
-2
-1
2
3
Zav2 = -1.96
Zw2 = 1.96
In the graphic above, what is the mean and standard deviation of the distribution? (enter the two values separated by a comma)
Expert Solution
This question has been solved!
Explore an expertly crafted, step-by-step solution for a thorough understanding of key concepts.

Step by step
Solved in 2 steps with 2 images

Recommended textbooks for you
Glencoe Algebra 1, Student Edition, 9780079039897…
Algebra
ISBN:
9780079039897
Author:
Carter
Publisher:
McGraw Hill
Glencoe Algebra 1, Student Edition, 9780079039897…
Algebra
ISBN:
9780079039897
Author:
Carter
Publisher:
McGraw Hill