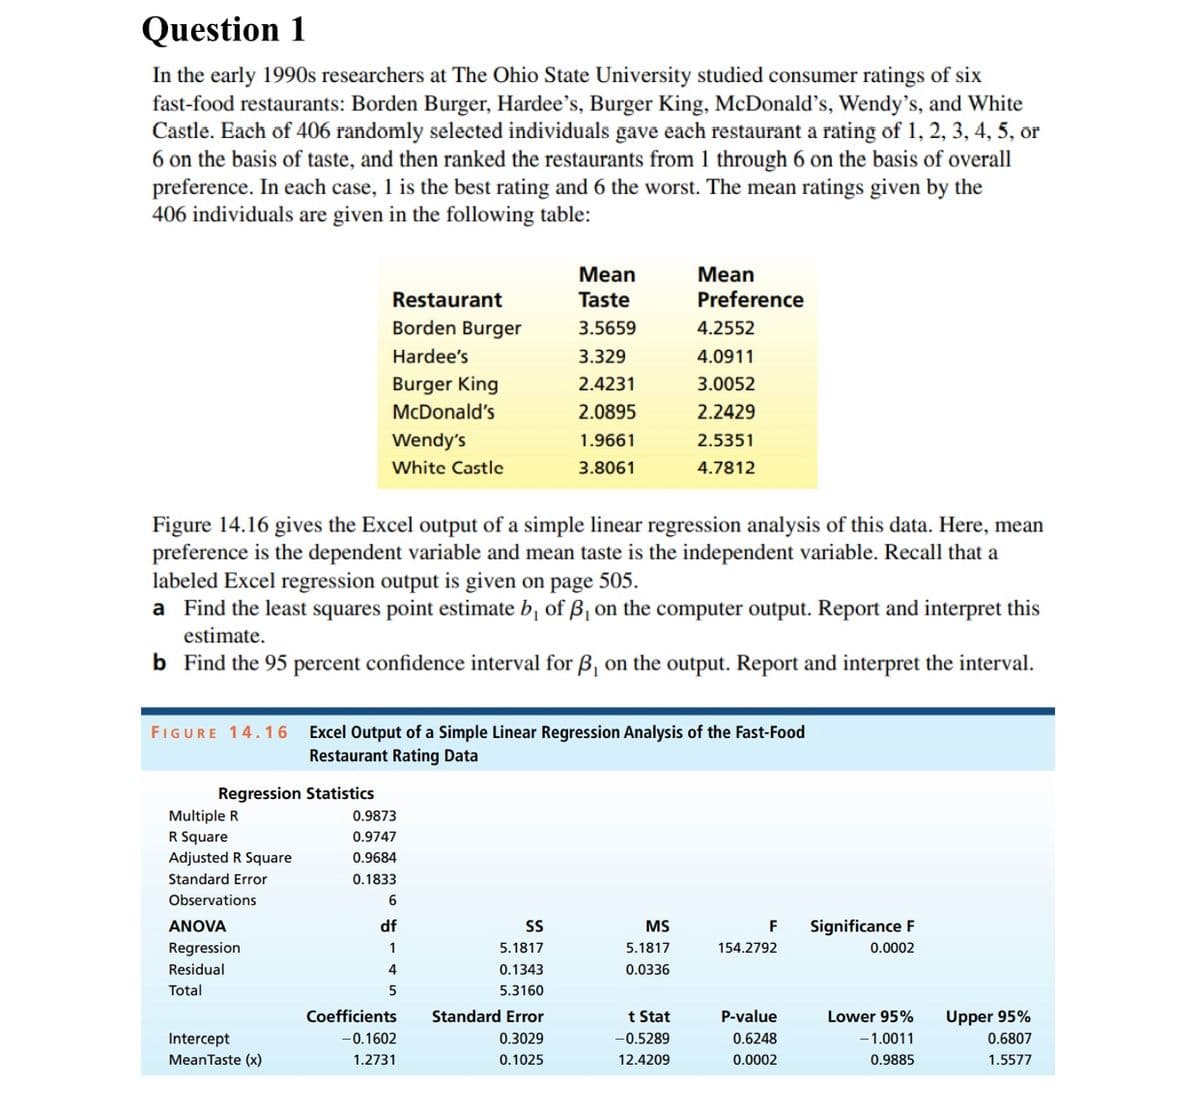
Question 1 In the early 1990s researchers at The Ohio State University studied consumer ratings of six fast-food restaurants: Borden Burger, Hardee's, Burger King, McDonald's, Wendy's, and White Castle. Each of 406 randomly selected individuals gave each restaurant a rating of 1, 2, 3, 4, 5, or 6 on the basis of taste, and then ranked the restaurants from 1 through 6 on the basis of overall preference. In each case, 1 is the best rating and 6 the worst. The mean ratings given by the 406 individuals are given in the following table: Mean Mean Taste Restaurant Preference Borden Burger 3.5659 4.2552 Hardee's 3.329 4.0911 Burger King 2.4231 3.0052 McDonald's 2.0895 2.2429 Wendy's 1.9661 2.5351 White Castle 3.8061 4.7812 Figure 14.16 gives the Excel output of a simple linear regression analysis of this data. Here, mean preference is the dependent variable and mean taste is the independent variable. Recall that a labeled Excel regression output is given on page 505. a Find the least squares point estimate b, of ß, on the computer output. Report and interpret this estimate. b Find the 95 percent confidence interval for B, on the output. Report and interpret the interval. FIGURE 14.16 Excel Output of a Simple Linear Regression Analysis of the Fast-Food Restaurant Rating Data Regression Statistics Multiple R 0.9873 R Square 0.9747 Adjusted R Square 0.9684 Standard Error 0.1833 Observations 6 ANOVA df SS Significance F MS 5.1817 F 154.2792 Regression 1 5.1817 0.0002 Residual 0.1343 0.0336 Total 5.3160 Standard Error t Stat Lower 95% P-value 0.6248 Intercept 0.3029 -0.5289 -1.0011 MeanTaste (x) 0.1025 12.4209 0.0002 0.9885 4 5 Coefficients -0.1602 1.2731 Upper 95% 0.6807 1.5577
Question 1 In the early 1990s researchers at The Ohio State University studied consumer ratings of six fast-food restaurants: Borden Burger, Hardee's, Burger King, McDonald's, Wendy's, and White Castle. Each of 406 randomly selected individuals gave each restaurant a rating of 1, 2, 3, 4, 5, or 6 on the basis of taste, and then ranked the restaurants from 1 through 6 on the basis of overall preference. In each case, 1 is the best rating and 6 the worst. The mean ratings given by the 406 individuals are given in the following table: Mean Mean Taste Restaurant Preference Borden Burger 3.5659 4.2552 Hardee's 3.329 4.0911 Burger King 2.4231 3.0052 McDonald's 2.0895 2.2429 Wendy's 1.9661 2.5351 White Castle 3.8061 4.7812 Figure 14.16 gives the Excel output of a simple linear regression analysis of this data. Here, mean preference is the dependent variable and mean taste is the independent variable. Recall that a labeled Excel regression output is given on page 505. a Find the least squares point estimate b, of ß, on the computer output. Report and interpret this estimate. b Find the 95 percent confidence interval for B, on the output. Report and interpret the interval. FIGURE 14.16 Excel Output of a Simple Linear Regression Analysis of the Fast-Food Restaurant Rating Data Regression Statistics Multiple R 0.9873 R Square 0.9747 Adjusted R Square 0.9684 Standard Error 0.1833 Observations 6 ANOVA df SS Significance F MS 5.1817 F 154.2792 Regression 1 5.1817 0.0002 Residual 0.1343 0.0336 Total 5.3160 Standard Error t Stat Lower 95% P-value 0.6248 Intercept 0.3029 -0.5289 -1.0011 MeanTaste (x) 0.1025 12.4209 0.0002 0.9885 4 5 Coefficients -0.1602 1.2731 Upper 95% 0.6807 1.5577

Glencoe Algebra 1, Student Edition, 9780079039897, 0079039898, 2018
18th Edition
ISBN:9780079039897
Author:Carter
Publisher:Carter
Chapter10: Statistics
Section10.6: Summarizing Categorical Data
Problem 10CYU

Related questions
Question
Transcribed Image Text:Question 1
In the early 1990s researchers at The Ohio State University studied consumer ratings of six
fast-food restaurants: Borden Burger, Hardee's, Burger King, McDonald's, Wendy's, and White
Castle. Each of 406 randomly selected individuals gave each restaurant a rating of 1, 2, 3, 4, 5, or
6 on the basis of taste, and then ranked the restaurants from 1 through 6 on the basis of overall
preference. In each case, 1 is the best rating and 6 the worst. The mean ratings given by the
406 individuals are given in the following table:
Mean
Mean
Taste
Restaurant
Preference
Borden Burger
3.5659
4.2552
Hardee's
3.329
4.0911
Burger King
2.4231
3.0052
McDonald's
2.0895
2.2429
Wendy's
1.9661
2.5351
White Castle
3.8061
4.7812
Figure 14.16 gives the Excel output of a simple linear regression analysis of this data. Here, mean
preference is the dependent variable and mean taste is the independent variable. Recall that a
labeled Excel regression output is given on page 505.
a Find the least squares point estimate b, of ß, on the computer output. Report and interpret this
estimate.
b Find the 95 percent confidence interval for B, on the output. Report and interpret the interval.
FIGURE 14.16
Excel Output of a Simple Linear Regression Analysis of the Fast-Food
Restaurant Rating Data
Multiple R
0.9873
R Square
0.9747
Adjusted R Square
0.9684
Standard Error
0.1833
Observations
6
ANOVA
df
SS
F
Significance F
MS
5.1817
Regression
1
5.1817
154.2792
0.0002
Residual
4
0.1343
0.0336
Total
5
5.3160
Coefficients Standard Error
t Stat
P-value
Lower 95%
Intercept
-0.1602
0.3029
-0.5289
0.6248
-1.0011
MeanTaste (x)
1.2731
0.1025
12.4209
0.0002
0.9885
Regression Statistics
Upper 95%
0.6807
1.5577
Expert Solution
This question has been solved!
Explore an expertly crafted, step-by-step solution for a thorough understanding of key concepts.

Step by step
Solved in 3 steps with 2 images

Recommended textbooks for you
Glencoe Algebra 1, Student Edition, 9780079039897…
Algebra
ISBN:
9780079039897
Author:
Carter
Publisher:
McGraw Hill

Holt Mcdougal Larson Pre-algebra: Student Edition…
Algebra
ISBN:
9780547587776
Author:
HOLT MCDOUGAL
Publisher:
HOLT MCDOUGAL
Glencoe Algebra 1, Student Edition, 9780079039897…
Algebra
ISBN:
9780079039897
Author:
Carter
Publisher:
McGraw Hill
Holt Mcdougal Larson Pre-algebra: Student Edition…
Algebra
ISBN:
9780547587776
Author:
HOLT MCDOUGAL
Publisher:
HOLT MCDOUGAL